1. Determine the number of wing flaps needed for 150,000 flying hours. 2. Is the regression model a good model? Why?
1. Determine the number of wing flaps needed for 150,000 flying hours. 2. Is the regression model a good model? Why?

Linear Algebra: A Modern Introduction
4th Edition
ISBN:9781285463247
Author:David Poole
Publisher:David Poole
Chapter7: Distance And Approximation
Section7.3: Least Squares Approximation
Problem 31EQ

Related questions
Question
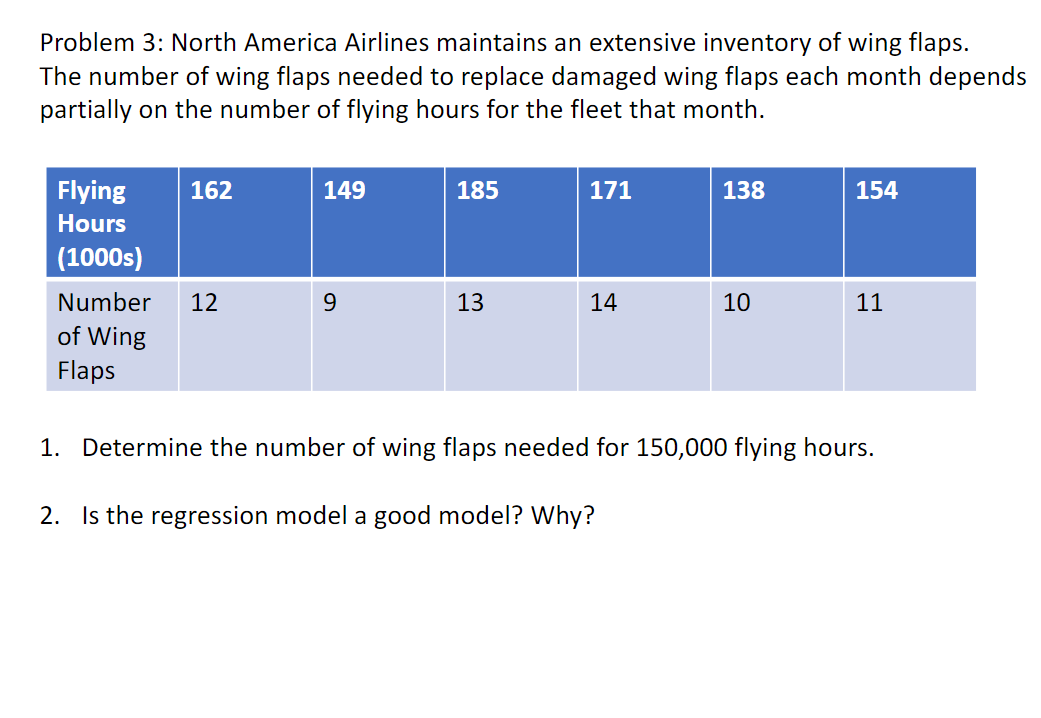
Transcribed Image Text:Problem 3: North America Airlines maintains an extensive inventory of wing flaps.
The number of wing flaps needed to replace damaged wing flaps each month depends
partially on the number of flying hours for the fleet that month.
Flying
162
149
185
171
138
154
Hours
(1000s)
Number
12
13
14
10
11
of Wing
Flaps
1. Determine the number of wing flaps needed for 150,000 flying hours.
2. Is the regression model a good model? Why?
Expert Solution
This question has been solved!
Explore an expertly crafted, step-by-step solution for a thorough understanding of key concepts.

This is a popular solution!

Trending now
This is a popular solution!

Step by step
Solved in 2 steps with 2 images

Recommended textbooks for you
Linear Algebra: A Modern Introduction
Algebra
ISBN:
9781285463247
Author:
David Poole
Publisher:
Cengage Learning

College Algebra
Algebra
ISBN:
9781305115545
Author:
James Stewart, Lothar Redlin, Saleem Watson
Publisher:
Cengage Learning
Linear Algebra: A Modern Introduction
Algebra
ISBN:
9781285463247
Author:
David Poole
Publisher:
Cengage Learning
College Algebra
Algebra
ISBN:
9781305115545
Author:
James Stewart, Lothar Redlin, Saleem Watson
Publisher:
Cengage Learning