In Table 2, provide expected proportions for two different MOIS: AD and SLR. The values in this table are computed using information from the Punnett Square and the specified MOI. Once the proportions are determined, we can fill in the values in Table 3, E(xpected) column. Table 2. AD proportions SLR proportions Phenotype Disease, Male Disease, Female WT, Male WT, Female Your assignment is to fill in Table 1 twice (make two copies of Table 1), once using the AD proportions in Table 2 to compute the E(xpected) column, and once using the SLR proportions in Table 2 to compute the E(xpected) column. Then, follow through, decide whether either/both/neither of the specified MOIS are consistent with the observed data, and report your results. I'll get you started with the AD MOI (Table 3): Table 3. (O-E)² (0-E)'/E Phenotype Disease, Male Disease, Female 285 WT, Male WT, Female E О-Е 304 =1157 x 0.375 (433.875) 267 301 =1157 x 0.125 (144.625) Total 1157 DF p-value
In Table 2, provide expected proportions for two different MOIS: AD and SLR. The values in this table are computed using information from the Punnett Square and the specified MOI. Once the proportions are determined, we can fill in the values in Table 3, E(xpected) column. Table 2. AD proportions SLR proportions Phenotype Disease, Male Disease, Female WT, Male WT, Female Your assignment is to fill in Table 1 twice (make two copies of Table 1), once using the AD proportions in Table 2 to compute the E(xpected) column, and once using the SLR proportions in Table 2 to compute the E(xpected) column. Then, follow through, decide whether either/both/neither of the specified MOIS are consistent with the observed data, and report your results. I'll get you started with the AD MOI (Table 3): Table 3. (O-E)² (0-E)'/E Phenotype Disease, Male Disease, Female 285 WT, Male WT, Female E О-Е 304 =1157 x 0.375 (433.875) 267 301 =1157 x 0.125 (144.625) Total 1157 DF p-value

College Algebra (MindTap Course List)
12th Edition
ISBN:9781305652231
Author:R. David Gustafson, Jeff Hughes
Publisher:R. David Gustafson, Jeff Hughes
Chapter8: Sequences, Series, And Probability
Section8.7: Probability
Problem 5E: List the sample space of each experiment. Rolling one die and tossing one coin

Related questions
Question
100%
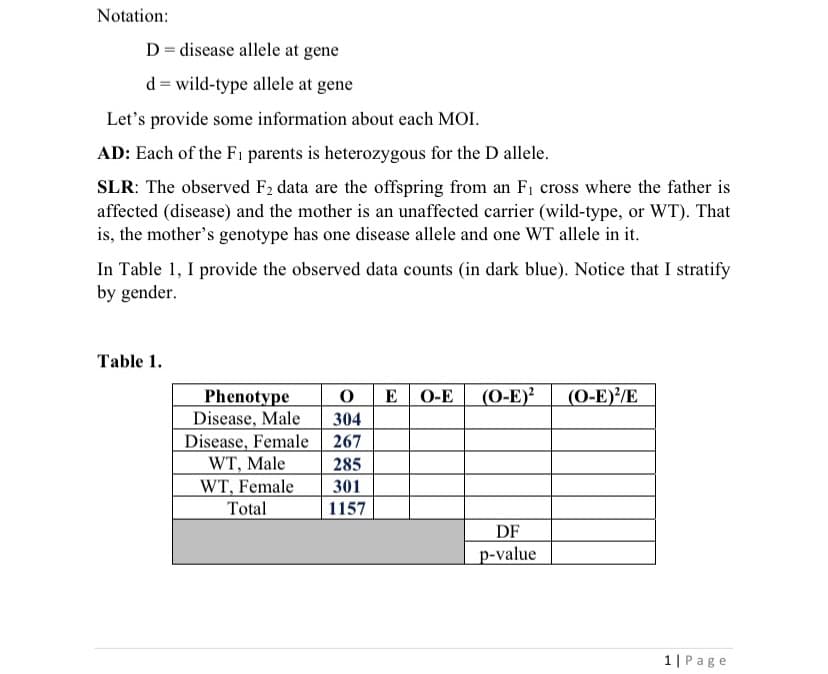
Transcribed Image Text:Notation:
D= disease allele at gene
d = wild-type allele at gene
Let's provide some information about each MOI.
AD: Each of the Fi parents is heterozygous for the D allele.
SLR: The observed F2 data are the offspring from an F1 cross where the father is
affected (disease) and the mother is an unaffected carrier (wild-type, or WT). That
is, the mother's genotype has one disease allele and one WT allele in it.
In Table 1, I provide the observed data counts (in dark blue). Notice that I stratify
by gender.
Table 1.
O E
(O-E)?
(O-E)/E
Phenotype
Disease, Male
Disease, Female
O-E
304
267
WT, Male
WT, Female
285
301
Total
1157
DF
p-value
1|Page
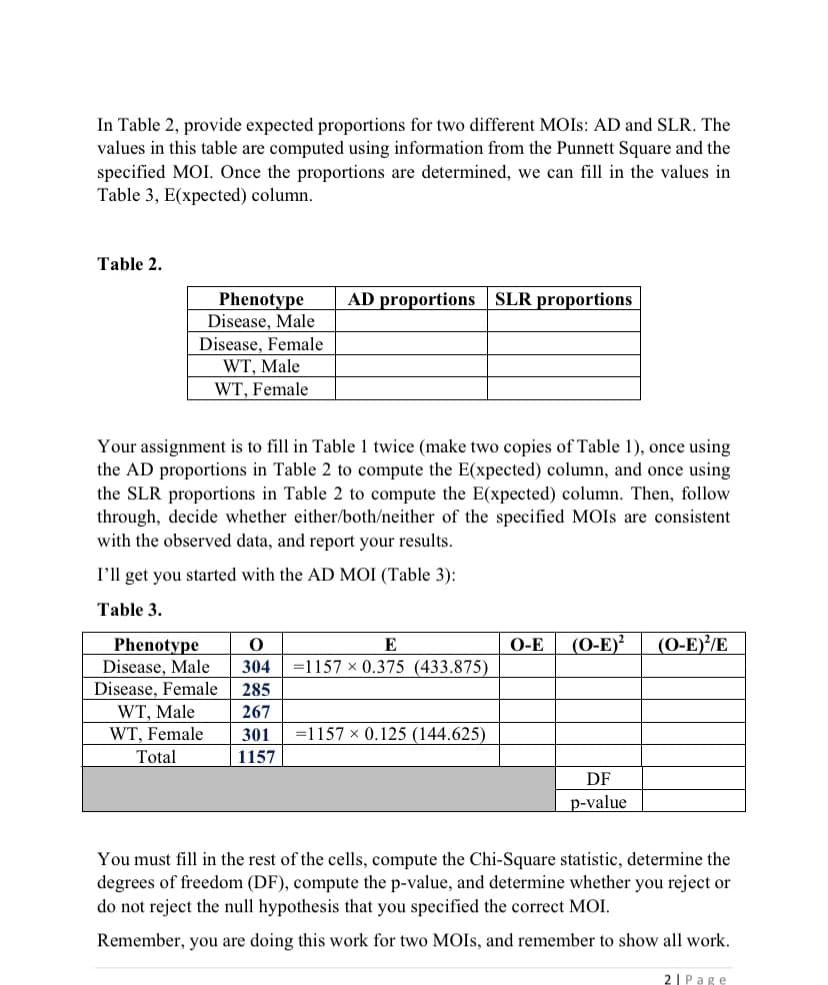
Transcribed Image Text:In Table 2, provide expected proportions for two different MOIS: AD and SLR. The
values in this table are computed using information from the Punnett Square and the
specified MOI. Once the proportions are determined, we can fill in the values in
Table 3, E(xpected) column.
Table 2.
AD proportions SLR proportions
Phenotype
Disease, Male
Disease, Female
WT, Male
WT, Female
Your assignment is to fill in Table 1 twice (make two copies of Table 1), once using
the AD proportions in Table 2 to compute the E(xpected) column, and once using
the SLR proportions in Table 2 to compute the E(xpected) column. Then, follow
through, decide whether either/both/neither of the specified MOIS are consistent
with the observed data, and report your results.
I'll get you started with the AD MOI (Table 3):
Table 3.
(O-E)?
(0-E)'/E
Phenotype
Disease, Male
Disease, Female
WT, Male
E
О-Е
304
=1157 x 0.375 (433.875)
285
267
WT, Female
301
=1157 x 0.125 (144.625)
Total
1157
DF
p-value
You must fill in the rest of the cells, compute the Chi-Square statistic, determine the
degrees of freedom (DF), compute the p-value, and determine whether you reject or
do not reject the null hypothesis that you specified the correct MOI.
Remember, you are doing this work for two MOIS, and remember to show all work.
2I Page
Expert Solution
This question has been solved!
Explore an expertly crafted, step-by-step solution for a thorough understanding of key concepts.

This is a popular solution!

Trending now
This is a popular solution!

Step by step
Solved in 2 steps with 4 images

Recommended textbooks for you
College Algebra (MindTap Course List)
Algebra
ISBN:
9781305652231
Author:
R. David Gustafson, Jeff Hughes
Publisher:
Cengage Learning
College Algebra (MindTap Course List)
Algebra
ISBN:
9781305652231
Author:
R. David Gustafson, Jeff Hughes
Publisher:
Cengage Learning