1. Determine whether the data is quantitative or qualitative. If it is quantitative, indicate whether it is continuous or discrete. a. The number of t-shirts you own b. The type of pen you use C. Places where you go on vacation d. The distance from your home to your school e. The number of classmates you have in Math 119 f. The tuition for the whole school year g. The type of phone you use h. TV station ratings i. TV channel preferences j. Height of basketball players
1. Determine whether the data is quantitative or qualitative. If it is quantitative, indicate whether it is continuous or discrete. a. The number of t-shirts you own b. The type of pen you use C. Places where you go on vacation d. The distance from your home to your school e. The number of classmates you have in Math 119 f. The tuition for the whole school year g. The type of phone you use h. TV station ratings i. TV channel preferences j. Height of basketball players

Glencoe Algebra 1, Student Edition, 9780079039897, 0079039898, 2018
18th Edition
ISBN:9780079039897
Author:Carter
Publisher:Carter
Chapter10: Statistics
Section: Chapter Questions
Problem 2MCQ

Related questions
Question
Transcribed Image Text:2.
3.
6.
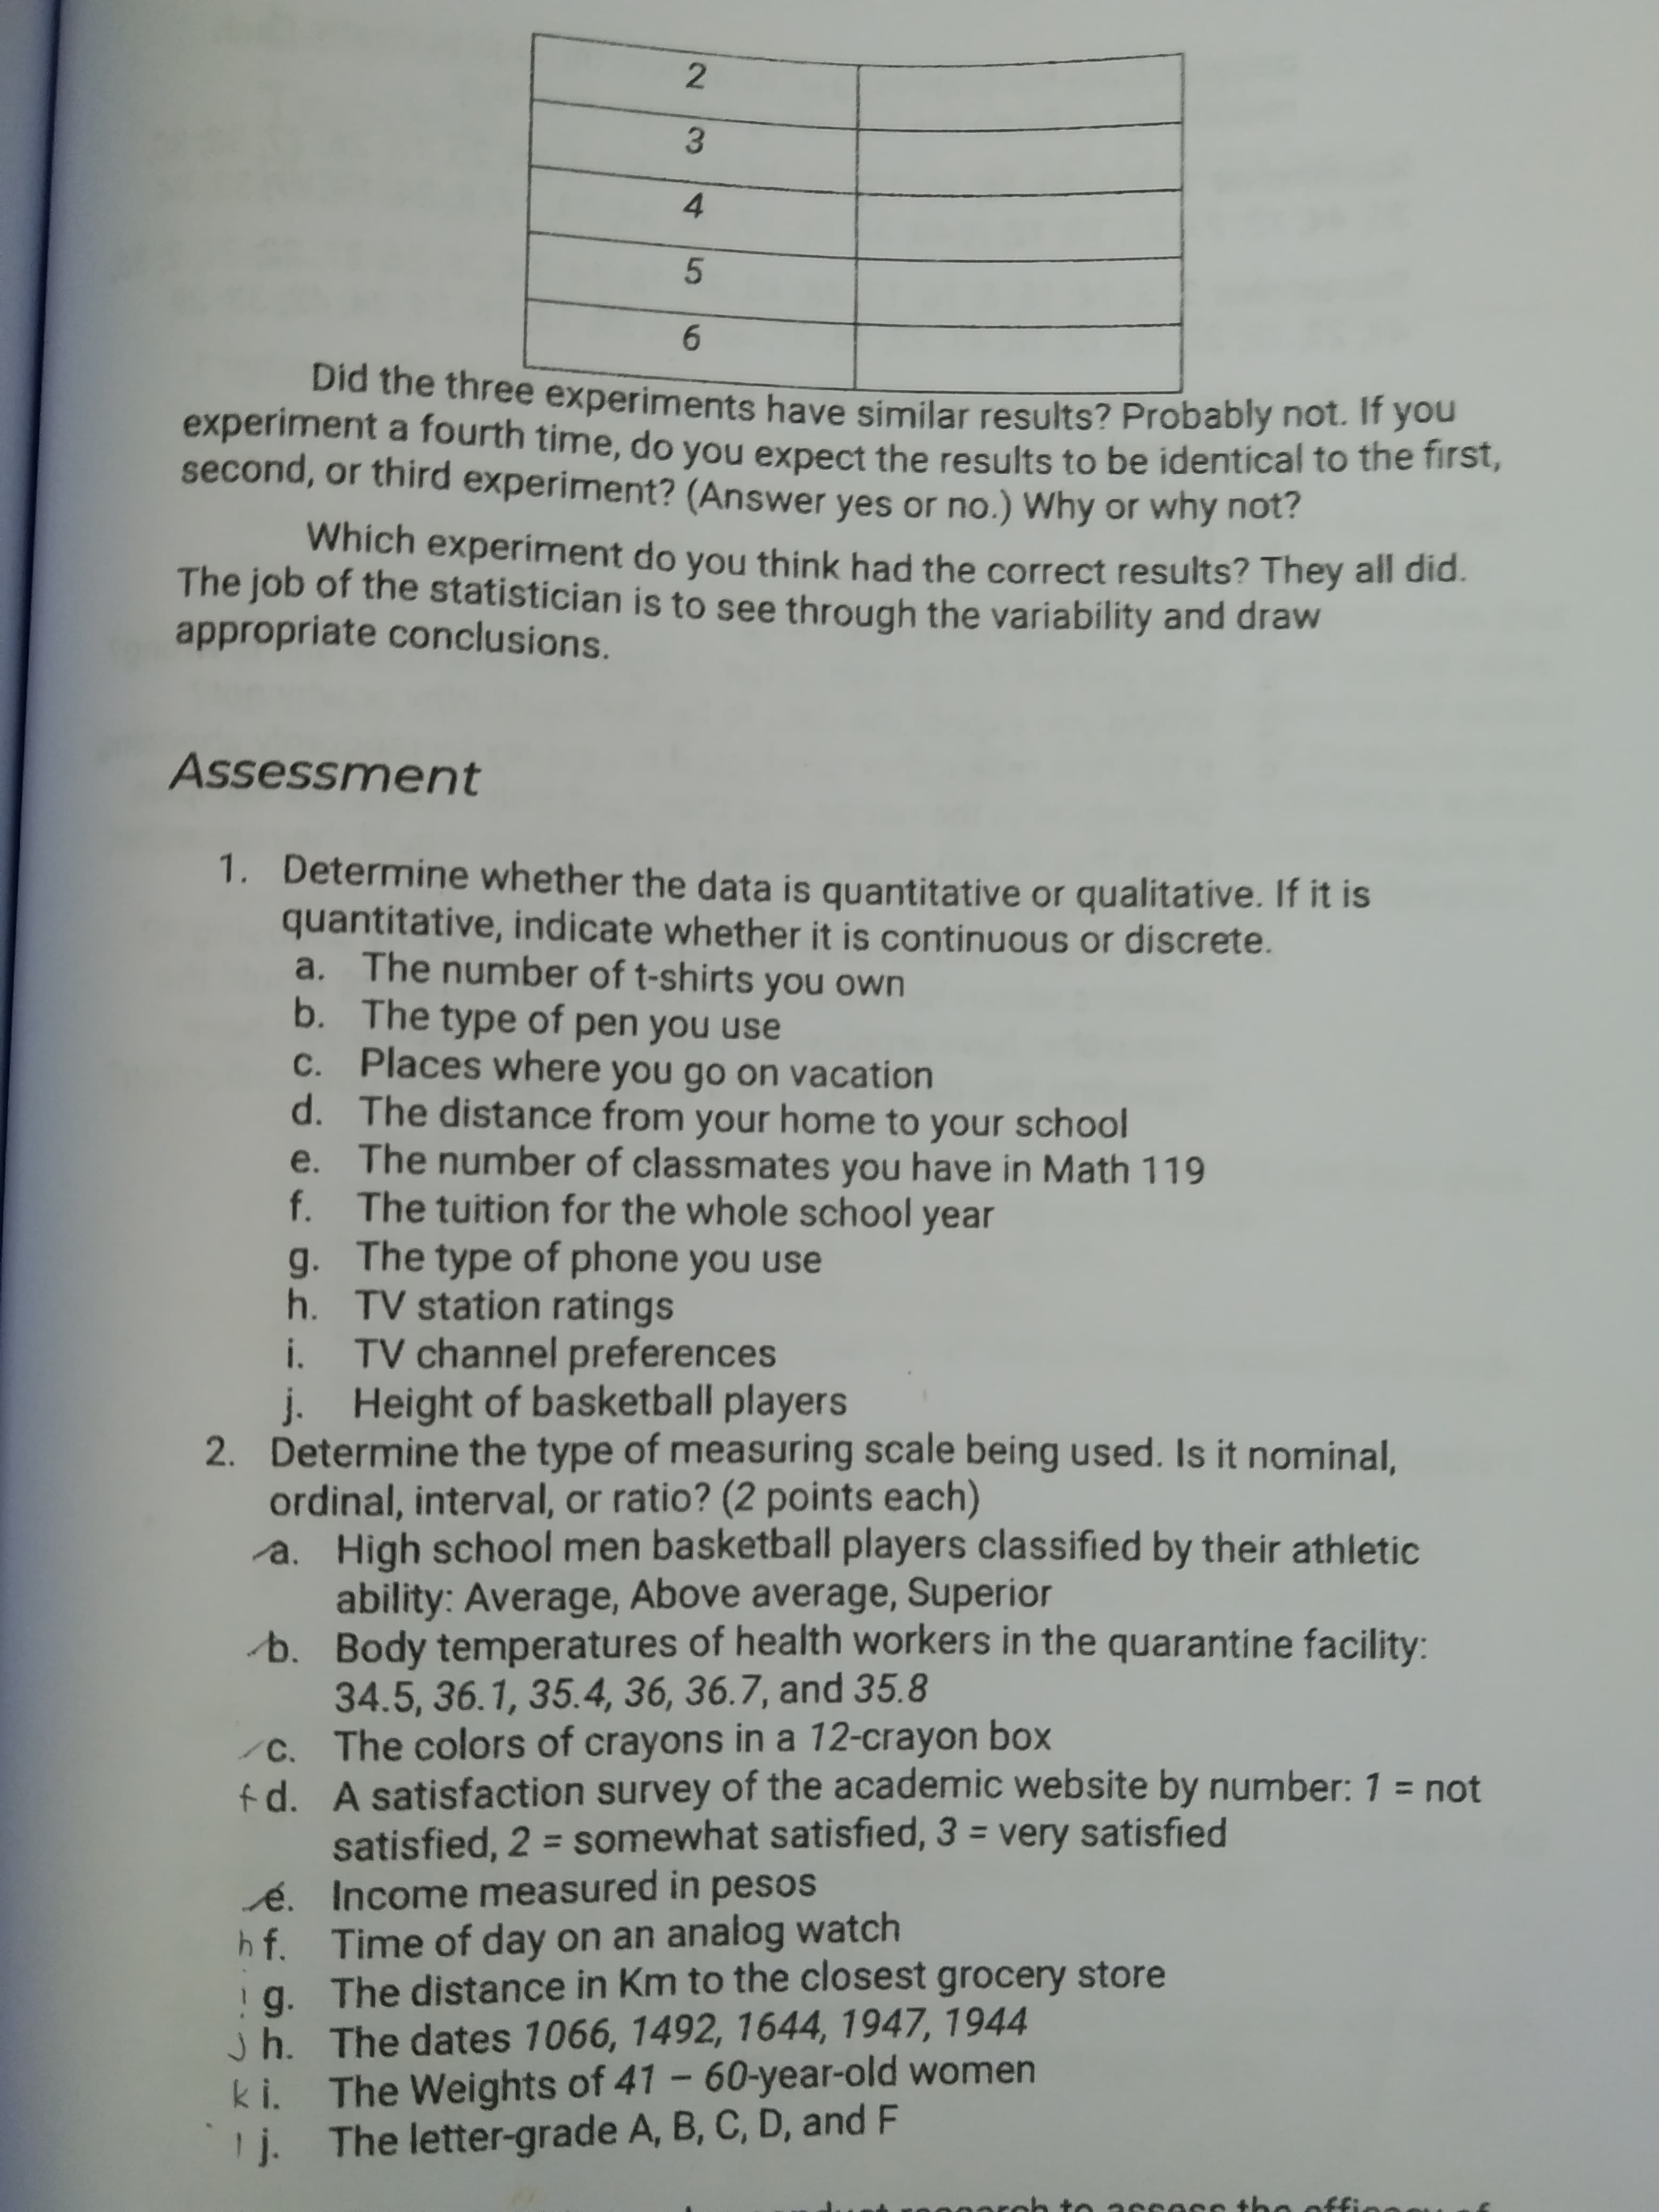
Did the three experiments have similar results? Probably not. If you
experiment a fourth time, do you expect the results to be identical to the first,
second, or third experiment? (Answer yes or no.) Why or why not?
Which experiment do you thínk had the correct results? They all did.
The job of the statistician is to see through the variability and draw
appropriate conclusions.
Assessment
1. Determine whether the data is quantitative or qualitative. If it is
quantitative, indicate whether it is continuous or discrete.
a. The number of t-shirts you own
b. The type of pen you use
C. Places where you go on vacation
d. The distance from your home to your school
e. The number of classmates you have in Math 119
f. The tuition for the whole school year
g. The type of phone you use
h. TV station ratings
i. TV channel preferences
j. Height of basketball players
2. Determine the type of measuring scale being used. Is it nominal,
ordinal, interval, or ratio? (2 points each)
a. High school men basketball players classified by their athletic
ability: Average, Above average, Superior
b. Body temperatures of health workers in the quarantine facility:
34.5, 36.1, 35.4, 36, 36.7, and 35.8
/C. The colors of crayons in a 12-crayon box
f d. A satisfaction survey of the academic website by number: 1 = not
satisfied, 2 = somewhat satisfied, 3 = very satisfied
é. Income measured in pesos
h f. Time of day on an analog watch
i g. The distance in Km to the closest grocery store
Jh. The dates 1066, 1492, 1644, 1947, 1944
k i. The Weights of 41 - 60-year-old women
j. The letter-grade A, B, C, D, and F
%3D
%3D
Transcribed Image Text:2.
3.
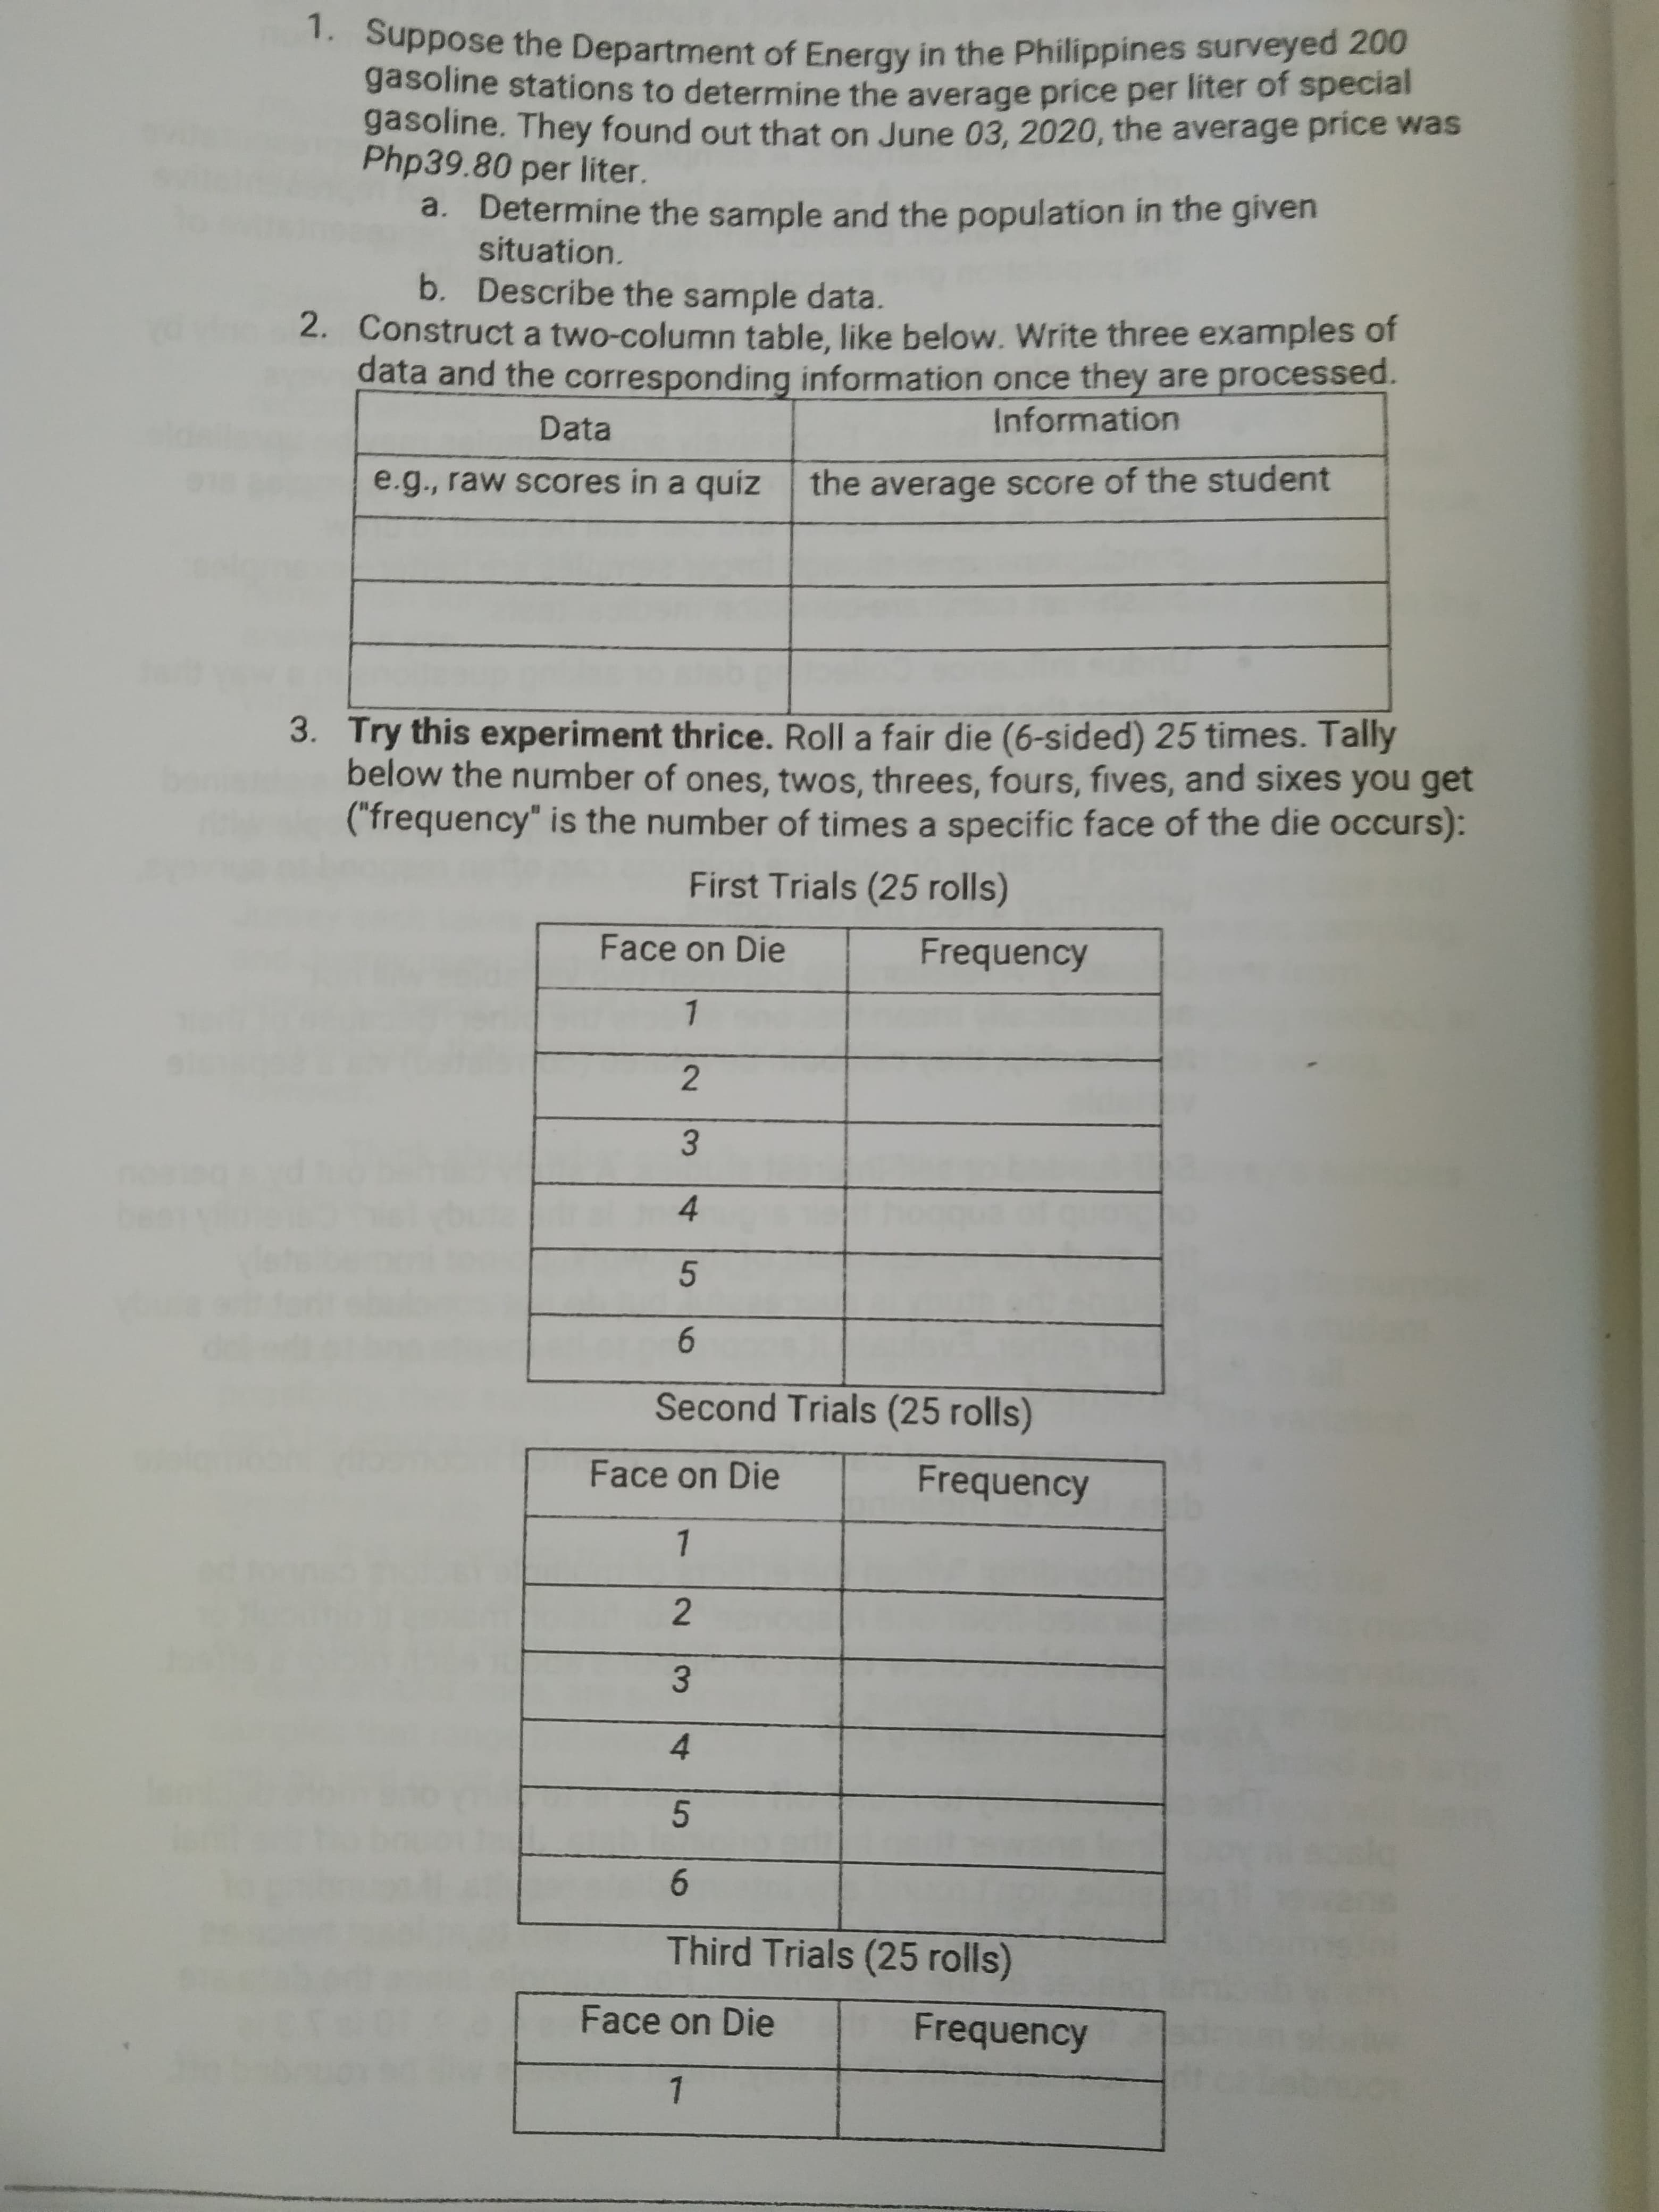
. Suppose the Department of Energy in the Philippines surveyed 200
gasoline stations to determine the average price per liter of special
gasoline. They found out that on June 03, 2020, the average price was
Php39.80 per liíter.
a. Determine the sample and the population in the given
situation.
b. Describe the sample data.
2. Construct a two-column table, like below. Write three examples of
data and the corresponding information once they are processed.
Information
Data
e.g., raw scores in a quiz
the average score of the student
3. Try this experiment thrice. Roll a fair die (6-sided) 25 times. Tally
below the number of ones, twos, threes, fours, fives, and sixes you get
("frequency" is the number of times a specific face of the die occurs):
First Trials (25 rolls)
Face on Die
Frequency
1
2
4.
Second Trials (25 rolls)
Face on Die
Frequency
1
3.
4.
6.
Third Trials (25 rolls)
Face on Die
Frequency
1.
Expert Solution
This question has been solved!
Explore an expertly crafted, step-by-step solution for a thorough understanding of key concepts.

Step by step
Solved in 2 steps with 1 images

Recommended textbooks for you
Glencoe Algebra 1, Student Edition, 9780079039897…
Algebra
ISBN:
9780079039897
Author:
Carter
Publisher:
McGraw Hill
Glencoe Algebra 1, Student Edition, 9780079039897…
Algebra
ISBN:
9780079039897
Author:
Carter
Publisher:
McGraw Hill