1. Economic fluctuations and growth The following table shows data on a hypothetical country's real GDP from 2000 through 2008: Real GDP Year (Billions of dollars) 2000 376 2001 384 2002 396 2003 408 2004 396 2005 392 2006 396 2007 404 2008 416 The grey line on the following graph shows the economy's long-term growth trend. Use the blue points (circle symbol) to plot the real GDP in each of the years listed. Be sure to plot from left to right. Line segments will connect the points. Next, place the green triangle on the graph to indicate the point on the real GDP curve that definitely represents a place the purple diamond on the graph to indicate the point on the real GDP curve that definitely represents a trough. 440 432 + Real GDP 424 416 408 Резk 400 + 392 Trough 384 376 368 360 2000 2001 2002 2003 2004 2005 2006 2007 2008 YEAR Calculate the percentage change in real GDP in each year, and then on the following graph use the orange points (square symbol) to plot percentage change in real GDP you've calculated, rounded to the nearest percent. For example, if the percentage change is -2.9412%, re Hint: The percentage change in real GDP equals the change in GDP from the previous year to the current year. For example, the percenta for 2001 can be calculated by finding the change in GDP from 2000 to 2001, dividing this change by the level of GDP in 2000, and then m result by 100%. For each year, plot the percentage change from the year before. For example, plot the growth rate from 2000 to 2001 us ntal seeadieata sf 200 REAL GDP
1. Economic fluctuations and growth The following table shows data on a hypothetical country's real GDP from 2000 through 2008: Real GDP Year (Billions of dollars) 2000 376 2001 384 2002 396 2003 408 2004 396 2005 392 2006 396 2007 404 2008 416 The grey line on the following graph shows the economy's long-term growth trend. Use the blue points (circle symbol) to plot the real GDP in each of the years listed. Be sure to plot from left to right. Line segments will connect the points. Next, place the green triangle on the graph to indicate the point on the real GDP curve that definitely represents a place the purple diamond on the graph to indicate the point on the real GDP curve that definitely represents a trough. 440 432 + Real GDP 424 416 408 Резk 400 + 392 Trough 384 376 368 360 2000 2001 2002 2003 2004 2005 2006 2007 2008 YEAR Calculate the percentage change in real GDP in each year, and then on the following graph use the orange points (square symbol) to plot percentage change in real GDP you've calculated, rounded to the nearest percent. For example, if the percentage change is -2.9412%, re Hint: The percentage change in real GDP equals the change in GDP from the previous year to the current year. For example, the percenta for 2001 can be calculated by finding the change in GDP from 2000 to 2001, dividing this change by the level of GDP in 2000, and then m result by 100%. For each year, plot the percentage change from the year before. For example, plot the growth rate from 2000 to 2001 us ntal seeadieata sf 200 REAL GDP

Essentials of Economics (MindTap Course List)
8th Edition
ISBN:9781337091992
Author:N. Gregory Mankiw
Publisher:N. Gregory Mankiw
Chapter15: Measuring A Nation's Income
Section: Chapter Questions
Problem 7PA

Related questions
Question
Hello Expert - I have attached the question as an image. The entire image provided is one question.
Kindly consider the question as a whole, and not as isolated pieces of information.
The questions require you to interact with the graph. Since you cannot do so, kindly be clear in which points you are marking by providing an image or in any way deemed suitable. Be clear as to how the graph must be interacted with.
Thank you for your time.
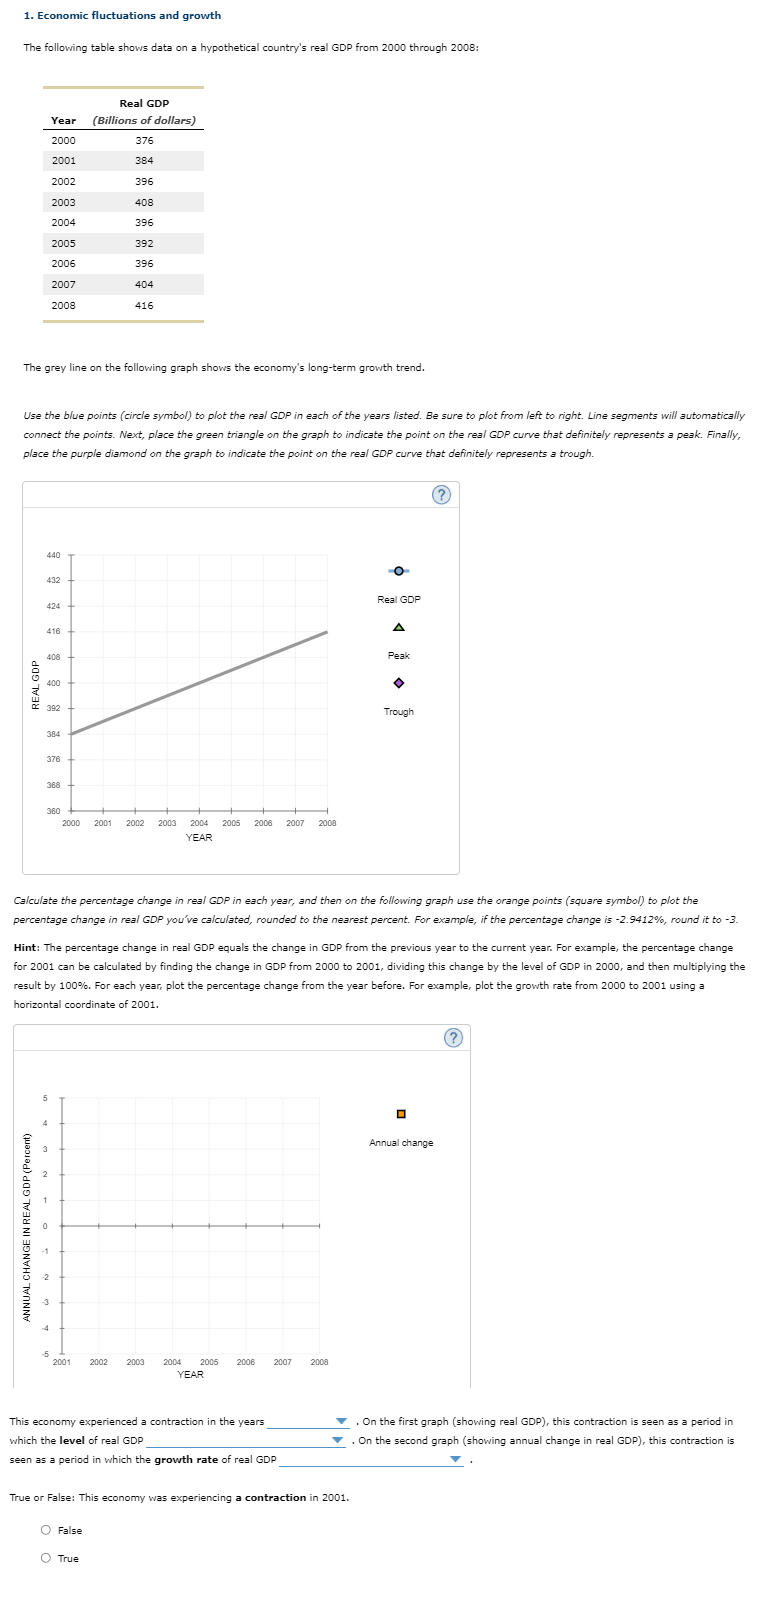
Transcribed Image Text:1. Economic fluctuations and growth
The following table shows data on a hypothetical country's real GDP from 2000 through 2008:
Real GDP
Year (Billions of dollars)
2000
376
2001
384
2002
396
2003
408
2004
396
2005
392
2006
396
2007
404
2008
416
The grey line on the following graph shows the economy's long-term growth trend.
Use the blue points (circle symbol) to plot the real GDP in each of the years listed. Be sure to plot from left to right. Line segments will automatically
connect the points. Next, place the green triangle on the graph to indicate the point on the real GDP curve that definitely represents a peak. Finally,
place the purple diamond on the graph to indicate the point on the real GDP curve that definitely represents a trough.
440
432
Real GDP
424
A
416
408
Peak
400
로 392
Trough
384
376
368
360
2000
2001
2002
2003
2004
2005
2006
2007
2008
YEAR
Calculate the percentage change in real GDP in each year, and then on the following graph use the orange points (square symbol) to plot the
percentage change in real GDP you've calculated, rounded to the nearest percent. For example, if the percentage change is -2.9412%, round it to -3.
Hint: The percentage change in real GDP equals the change in GDP from the previous year to the current year. For example, the percentage change
for 2001 can be calculated by finding the change in GDP from 2000 to 2001, dividing this change by the level of GDP in 2000, and then multiplying the
result by 100%. For each year, plot the percentage change from the year before. For example, plot the growth rate from 2000 to 2001 using a
horizontal coordinate of 2001.
(?
4
Annual change
1.
-1
-2
-3
-4
-5
2001
2002
2003
2004
2005
2006
2007
2008
YEAR
. On the first graph (showing real GDP), this contraction is seen as a period in
On the second graph (showing annual change in real GDP), this contraction is
This economy experienced a contraction in the years
which the level of real GDP
seen as a period in which the growth rate of real GDP
True or False: This economy was experiencing a contraction in 2001.
O False
O True
ANNUAL CHANGE IN REAL GDP (Percent)
REAL GDP
Expert Solution
This question has been solved!
Explore an expertly crafted, step-by-step solution for a thorough understanding of key concepts.

This is a popular solution!

Trending now
This is a popular solution!

Step by step
Solved in 3 steps with 2 images

Knowledge Booster


Learn more about
Need a deep-dive on the concept behind this application? Look no further. Learn more about this topic, economics and related others by exploring similar questions and additional content below.Recommended textbooks for you
Essentials of Economics (MindTap Course List)
Economics
ISBN:
9781337091992
Author:
N. Gregory Mankiw
Publisher:
Cengage Learning

Brief Principles of Macroeconomics (MindTap Cours…
Economics
ISBN:
9781337091985
Author:
N. Gregory Mankiw
Publisher:
Cengage Learning

Economics: Private and Public Choice (MindTap Cou…
Economics
ISBN:
9781305506725
Author:
James D. Gwartney, Richard L. Stroup, Russell S. Sobel, David A. Macpherson
Publisher:
Cengage Learning
Essentials of Economics (MindTap Course List)
Economics
ISBN:
9781337091992
Author:
N. Gregory Mankiw
Publisher:
Cengage Learning
Brief Principles of Macroeconomics (MindTap Cours…
Economics
ISBN:
9781337091985
Author:
N. Gregory Mankiw
Publisher:
Cengage Learning
Economics: Private and Public Choice (MindTap Cou…
Economics
ISBN:
9781305506725
Author:
James D. Gwartney, Richard L. Stroup, Russell S. Sobel, David A. Macpherson
Publisher:
Cengage Learning

Macroeconomics: Private and Public Choice (MindTa…
Economics
ISBN:
9781305506756
Author:
James D. Gwartney, Richard L. Stroup, Russell S. Sobel, David A. Macpherson
Publisher:
Cengage Learning


Principles of Economics 2e
Economics
ISBN:
9781947172364
Author:
Steven A. Greenlaw; David Shapiro
Publisher:
OpenStax