1. Engagement Activity: Frequency Distributions Once researchers have collected data for their research study, they need to put it into some comprehensible form so they can see any patterns in the data. A frequency distribution provides an overview of how many people fall into each category of whatever scale of measurement was used. This makes it very easy to get a good big picture view of the data. You can see an example of this by participating in the following experiment. Accuracy 95.3% 100% 79.7% 81.1% 80% 75.8 60% 40% 20% 6.7% Typica You 0% Non-words Words Non-words Words Shown on Left Shown on Right Were you able to read the graphs and understand the data that was being shown? Yes O No Look at the final graph. How would you describe a typical participant's performance? The participant is faster at recognizing both non-words and real words when presented in the left visual field. The participant is worse at recognizing words presented in the left visual field. The participant is better at recognizing words presented in the left visual field. O The participant is better at recognizing non-words than real words when stimuli appear in the right visual field. Were your own results similar to those of the typical participant? (Note: Just respond honestly, either answer will be considered correct.) O No O Yes
1. Engagement Activity: Frequency Distributions Once researchers have collected data for their research study, they need to put it into some comprehensible form so they can see any patterns in the data. A frequency distribution provides an overview of how many people fall into each category of whatever scale of measurement was used. This makes it very easy to get a good big picture view of the data. You can see an example of this by participating in the following experiment. Accuracy 95.3% 100% 79.7% 81.1% 80% 75.8 60% 40% 20% 6.7% Typica You 0% Non-words Words Non-words Words Shown on Left Shown on Right Were you able to read the graphs and understand the data that was being shown? Yes O No Look at the final graph. How would you describe a typical participant's performance? The participant is faster at recognizing both non-words and real words when presented in the left visual field. The participant is worse at recognizing words presented in the left visual field. The participant is better at recognizing words presented in the left visual field. O The participant is better at recognizing non-words than real words when stimuli appear in the right visual field. Were your own results similar to those of the typical participant? (Note: Just respond honestly, either answer will be considered correct.) O No O Yes

Glencoe Algebra 1, Student Edition, 9780079039897, 0079039898, 2018
18th Edition
ISBN:9780079039897
Author:Carter
Publisher:Carter
Chapter10: Statistics
Section10.6: Summarizing Categorical Data
Problem 42PFA

Related questions
Topic Video
Question
Can someone help with this question please.
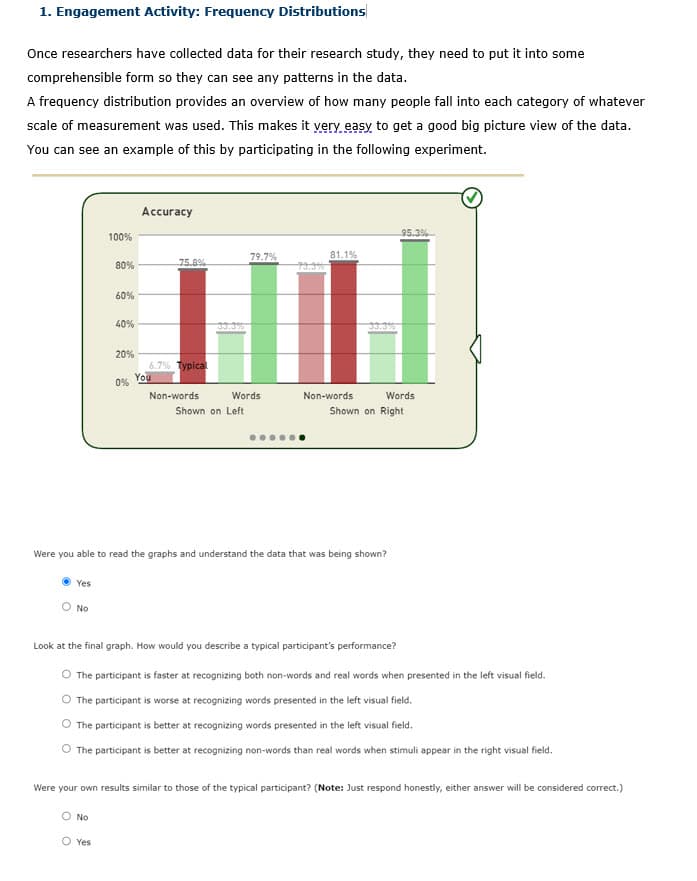
Transcribed Image Text:1. Engagement Activity: Frequency Distributions
Once researchers have collected data for their research study, they need to put it into some
comprehensible form so they can see any patterns in the data.
A frequency distribution provides an overview of how many people fall into each category of whatever
scale of measurement was used. This makes it very, easy to get a good big picture view of the data.
You can see an example of this by participating in the following experiment.
Accuracy
95.3%
100%
79.7%
81.1%
80%
75.8%
60%
40%
20%
6.7% Typica
You
0%
Non-words
Words
Non-words
Words
Shown on Left
Shown on Right
Were you able to read the graphs and understand the data that was being shown?
Yes
No
Look at the final graph. How would you describe a typical participant's performance?
The participant is faster at recognizing both non-words and real words when presented in the left visual field.
The participant is worse at recognizing words presented in the left visual field.
The participant is better at recognizing words presented in the left visual field.
The participant is better at recognizing non-words than real words when stimuli appear in the right visual field.
Were your own results similar to those of the typical participant? (Note: Just respond honestly, either answer will be considered correct.)
O No
O Yes
Expert Solution
This question has been solved!
Explore an expertly crafted, step-by-step solution for a thorough understanding of key concepts.

This is a popular solution!

Trending now
This is a popular solution!

Step by step
Solved in 2 steps

Knowledge Booster


Learn more about
Need a deep-dive on the concept behind this application? Look no further. Learn more about this topic, statistics and related others by exploring similar questions and additional content below.Recommended textbooks for you
Glencoe Algebra 1, Student Edition, 9780079039897…
Algebra
ISBN:
9780079039897
Author:
Carter
Publisher:
McGraw Hill
Glencoe Algebra 1, Student Edition, 9780079039897…
Algebra
ISBN:
9780079039897
Author:
Carter
Publisher:
McGraw Hill