(a) Construct a frequency distribution. Blood Type Frequency A 19 АВ 3 B 7 21 (Type whole numbers.) (b) Construct a relative frequency distribution. Blood Type Frequency A 0.38 АВ 0.06 В 0.14 0.42 (Simplify your answers.) (c) According to the data, which blood type is most common?
(a) Construct a frequency distribution. Blood Type Frequency A 19 АВ 3 B 7 21 (Type whole numbers.) (b) Construct a relative frequency distribution. Blood Type Frequency A 0.38 АВ 0.06 В 0.14 0.42 (Simplify your answers.) (c) According to the data, which blood type is most common?

Glencoe Algebra 1, Student Edition, 9780079039897, 0079039898, 2018
18th Edition
ISBN:9780079039897
Author:Carter
Publisher:Carter
Chapter10: Statistics
Section10.6: Summarizing Categorical Data
Problem 4CGP

Related questions
Question
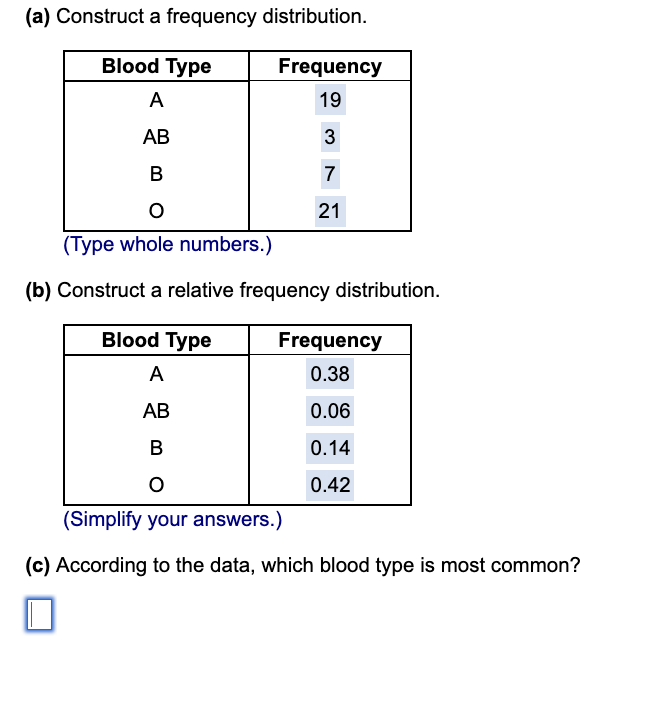
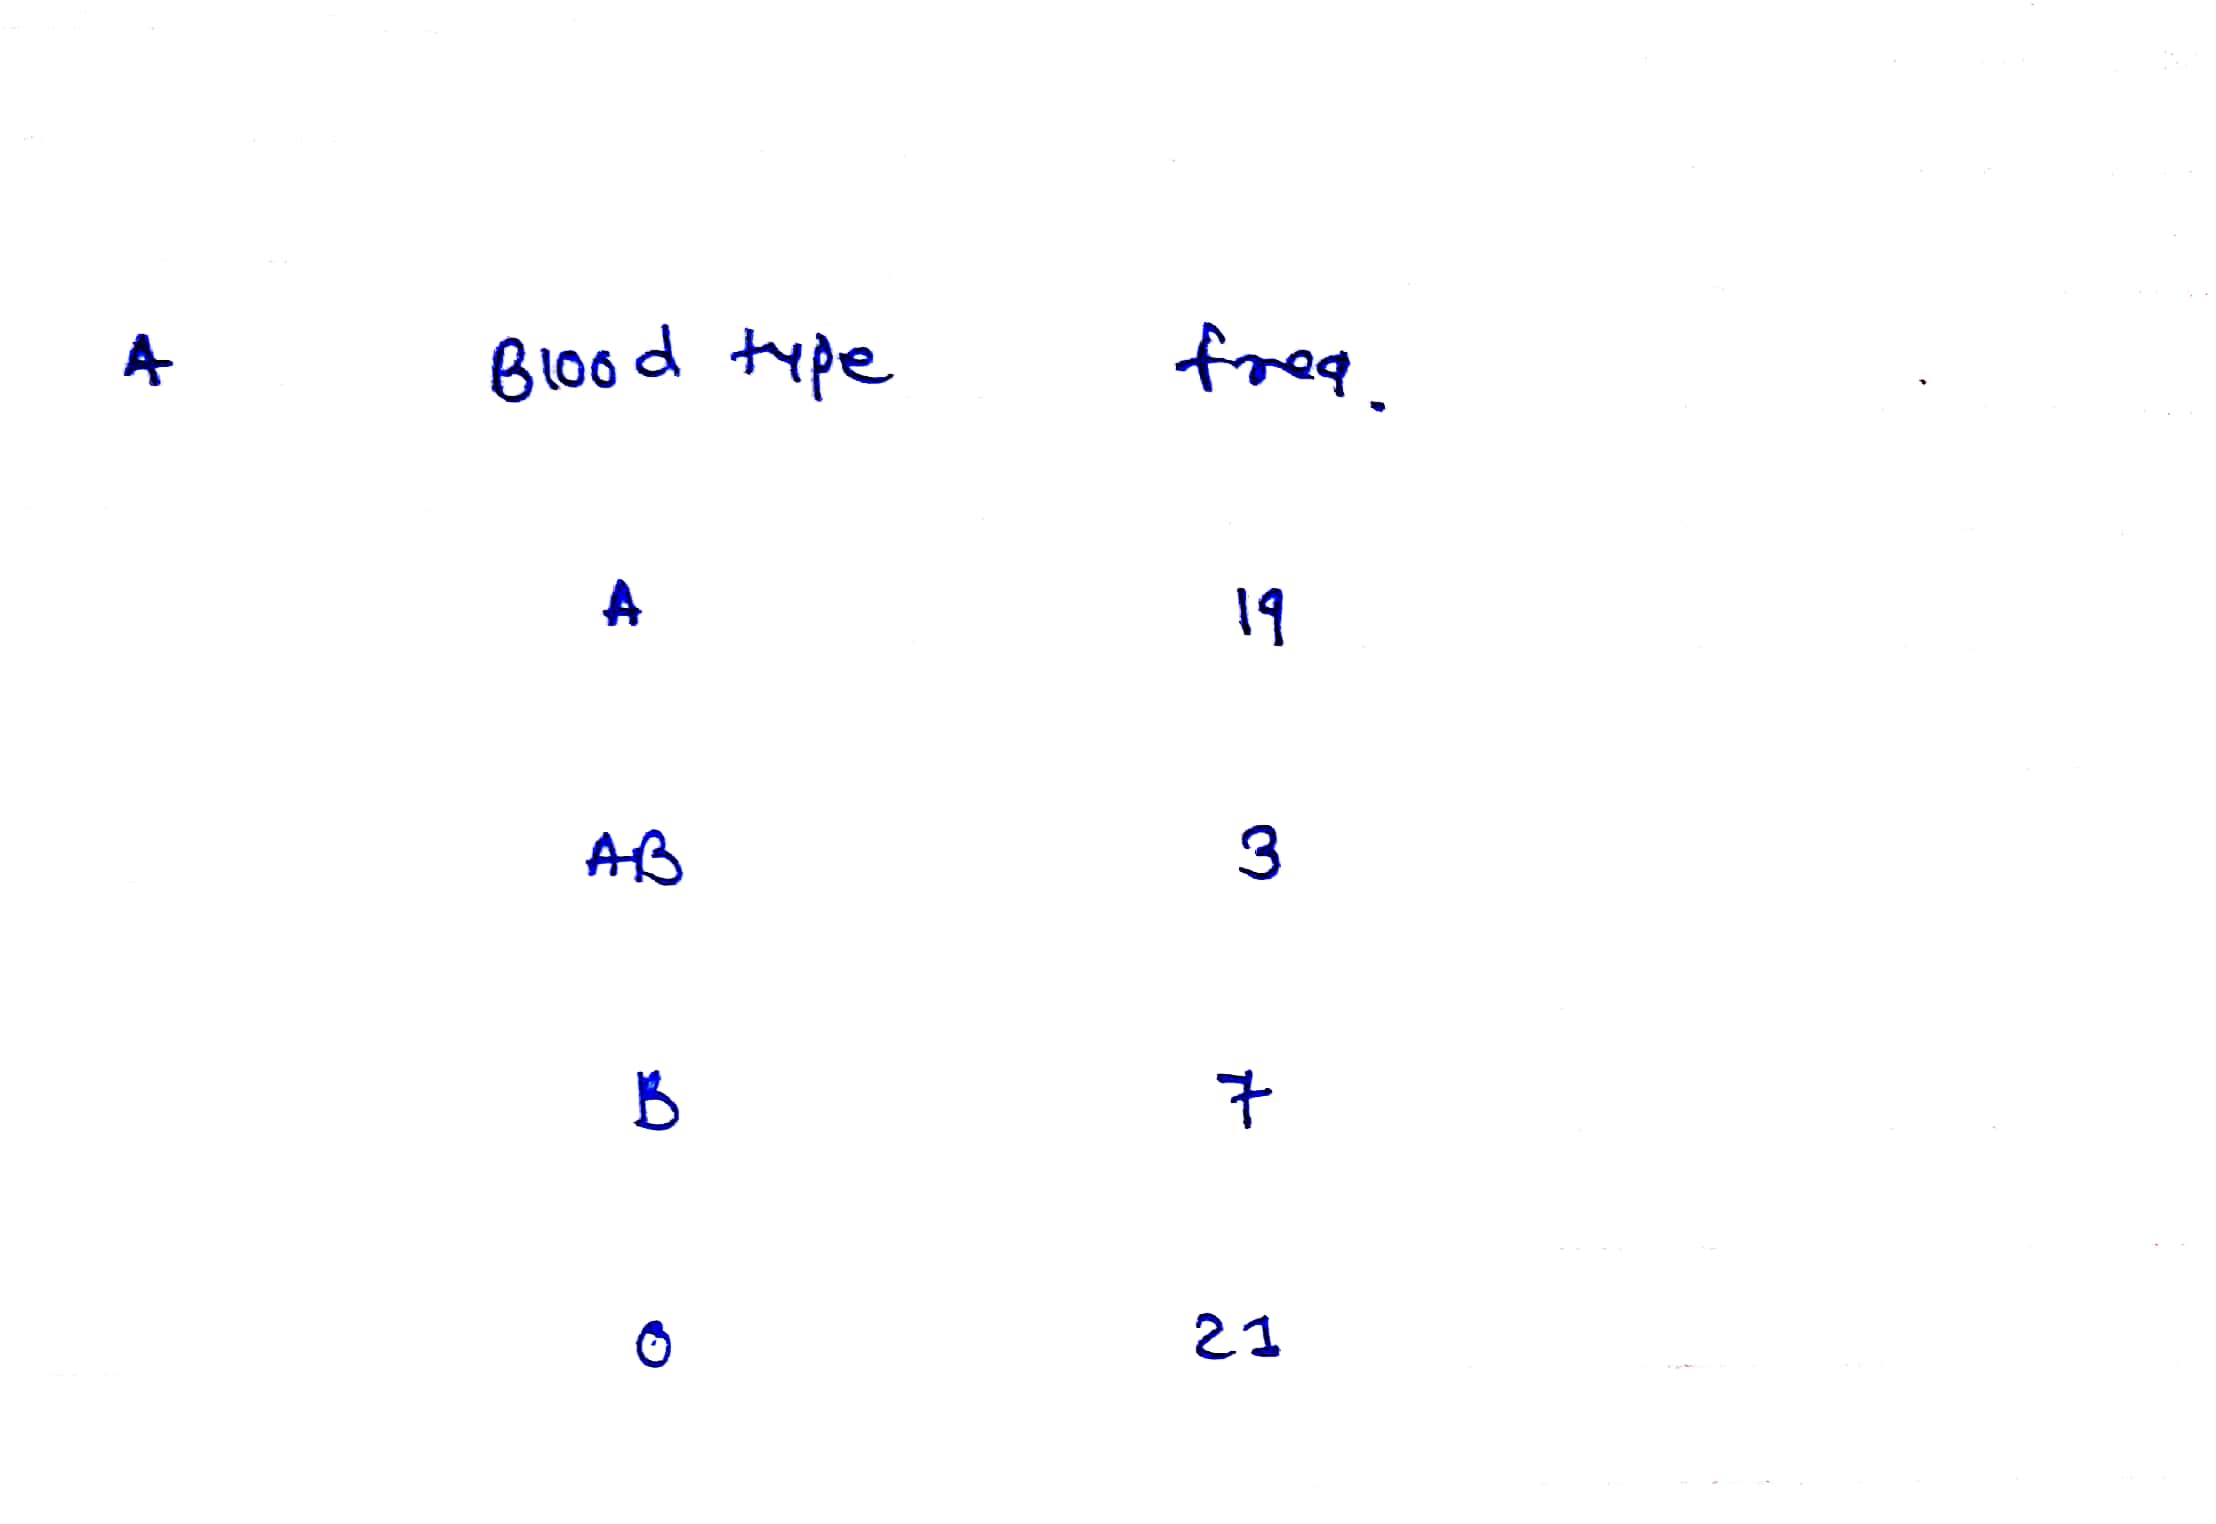
Transcribed Image Text:(a) Construct a frequency distribution.
Blood Type
Frequency
A
19
АВ
3
B
7
21
(Type whole numbers.)
(b) Construct a relative frequency distribution.
Blood Type
Frequency
A
0.38
АВ
0.06
B
0.14
0.42
(Simplify your answers.)
(c) According to the data, which blood type is most common?
Expert Solution
Step 1

Step by step
Solved in 2 steps with 2 images

Recommended textbooks for you
Glencoe Algebra 1, Student Edition, 9780079039897…
Algebra
ISBN:
9780079039897
Author:
Carter
Publisher:
McGraw Hill
Glencoe Algebra 1, Student Edition, 9780079039897…
Algebra
ISBN:
9780079039897
Author:
Carter
Publisher:
McGraw Hill