Minority Models - Negative stereotypical depiction of minorities or their exclusion from advertisements in mainstream media has been found to have harmful social effects. Researchers are interested in answering the following question: Is the proportion of magazine advertisements portraying each racial group different from its proportion of the U.S. population? The observed data in the table below is consistent with data collected from an analysis of magazine advertisements from 1993 and 1994. The table summarizes the frequency of the appearance of models in a total of 1527 advertisements. The population distribution values were taken from the 1990 census data. African Asian Hispanic White Americans Americans Americans Americans 1990 Census data (%) 12.1% 3.3% 9.0% 75.6% Observed Data 151 74 80 1222 Round all calculated values to 4 decimal places where appropriate. 1. Select the phrases to complete the null and alternative hypotheses for this research situation. Họ: The proportion of magazine advertisements portraying each racial group is the same as v its proportion of the U.S. population. HA: The proportion of magazine advertisements portraying each racial group is different from v its proportion of the U.S. population. 2. What type of test should the researchers use? OA. t-test for a sample mean OB. t-test for the slope of the regression line OC. x² goodness of fit test OD. x? test of independence OE. Z-test for one population proportion 3. Which of the following conditions must be met for the hypothesis test to be valid? Select all that apply. OA. There must be at least 10 "success" and 10 "failure" observations. OB. There must be an expected count of at least 5 for each level of the categorical variable. OC. Each case in the table must be independent of all other cases. OD. There must be at least 3 levels of the categorical variable. OE. The sample size must be at least 30 or the population data must be normally distributed.
Minority Models - Negative stereotypical depiction of minorities or their exclusion from advertisements in mainstream media has been found to have harmful social effects. Researchers are interested in answering the following question: Is the proportion of magazine advertisements portraying each racial group different from its proportion of the U.S. population? The observed data in the table below is consistent with data collected from an analysis of magazine advertisements from 1993 and 1994. The table summarizes the frequency of the appearance of models in a total of 1527 advertisements. The population distribution values were taken from the 1990 census data. African Asian Hispanic White Americans Americans Americans Americans 1990 Census data (%) 12.1% 3.3% 9.0% 75.6% Observed Data 151 74 80 1222 Round all calculated values to 4 decimal places where appropriate. 1. Select the phrases to complete the null and alternative hypotheses for this research situation. Họ: The proportion of magazine advertisements portraying each racial group is the same as v its proportion of the U.S. population. HA: The proportion of magazine advertisements portraying each racial group is different from v its proportion of the U.S. population. 2. What type of test should the researchers use? OA. t-test for a sample mean OB. t-test for the slope of the regression line OC. x² goodness of fit test OD. x? test of independence OE. Z-test for one population proportion 3. Which of the following conditions must be met for the hypothesis test to be valid? Select all that apply. OA. There must be at least 10 "success" and 10 "failure" observations. OB. There must be an expected count of at least 5 for each level of the categorical variable. OC. Each case in the table must be independent of all other cases. OD. There must be at least 3 levels of the categorical variable. OE. The sample size must be at least 30 or the population data must be normally distributed.

Glencoe Algebra 1, Student Edition, 9780079039897, 0079039898, 2018
18th Edition
ISBN:9780079039897
Author:Carter
Publisher:Carter
Chapter10: Statistics
Section: Chapter Questions
Problem 13PT

Related questions
Question
I need help with 3 and 9
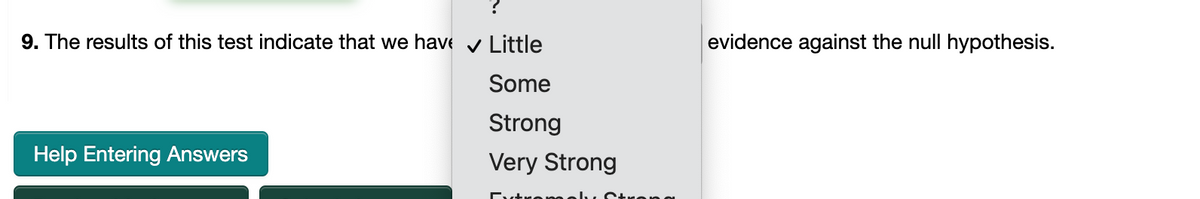
Transcribed Image Text:9. The results of this test indicate that we have v Little
evidence against the null hypothesis.
Some
Strong
Help Entering Answers
Very Strong
Dtrom
Transcribed Image Text:poinis)
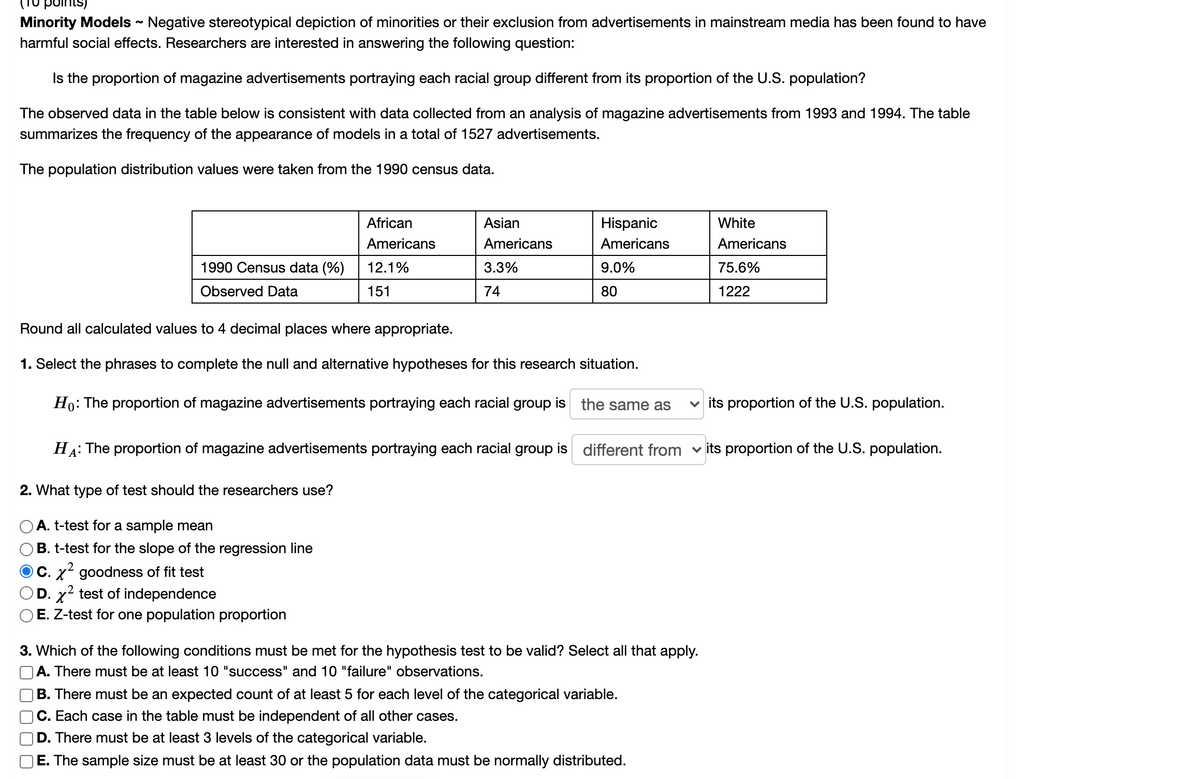
Minority Models - Negative stereotypical depiction of minorities or their exclusion from advertisements in mainstream media has been found to have
harmful social effects. Researchers are interested in answering the following question:
Is the proportion of magazine advertisements portraying each racial group different from its proportion of the U.S. population?
The observed data in the table below is consistent with data collected from an analysis of magazine advertisements from 1993 and 1994. The table
summarizes the frequency of the appearance of models in a total of 1527 advertisements.
The population distribution values were taken from the 1990 census data.
African
Asian
Hispanic
White
Americans
Americans
Americans
Americans
1990 Census data (%)
12.1%
3.3%
9.0%
75.6%
Observed Data
151
74
80
1222
Round all calculated values to 4 decimal places where appropriate.
1. Select the phrases to complete the null and alternative hypotheses for this research situation.
Ho: The proportion of magazine advertisements portraying each racial group is the same as
v its proportion of the U.S. population.
The proportion of magazine advertisements portraying each racial group is different from v its proportion of the U.S. population.
HA:
2. What type of test should the researchers use?
A. t-test for a sample mean
B. t-test for the slope of the regression line
.2
C. x goodness of fit test
O D. x2 test of independence
O E. Z-test for one population proportion
3. Which of the following conditions must be met for the hypothesis test to be valid? Select all that apply.
A. There must be at least 10 "success" and 10 "failure" observations.
B. There must be an expected count of at least 5 for each level of the categorical variable.
C. Each case in the table must be independent of all other cases.
D. There must be at least 3 levels of the categorical variable.
E. The sample size must be at least 30 or the population data must be normally distributed.
Expert Solution
This question has been solved!
Explore an expertly crafted, step-by-step solution for a thorough understanding of key concepts.

Step by step
Solved in 2 steps with 5 images

Knowledge Booster


Learn more about
Need a deep-dive on the concept behind this application? Look no further. Learn more about this topic, statistics and related others by exploring similar questions and additional content below.Recommended textbooks for you
Glencoe Algebra 1, Student Edition, 9780079039897…
Algebra
ISBN:
9780079039897
Author:
Carter
Publisher:
McGraw Hill

Big Ideas Math A Bridge To Success Algebra 1: Stu…
Algebra
ISBN:
9781680331141
Author:
HOUGHTON MIFFLIN HARCOURT
Publisher:
Houghton Mifflin Harcourt

Holt Mcdougal Larson Pre-algebra: Student Edition…
Algebra
ISBN:
9780547587776
Author:
HOLT MCDOUGAL
Publisher:
HOLT MCDOUGAL
Glencoe Algebra 1, Student Edition, 9780079039897…
Algebra
ISBN:
9780079039897
Author:
Carter
Publisher:
McGraw Hill
Big Ideas Math A Bridge To Success Algebra 1: Stu…
Algebra
ISBN:
9781680331141
Author:
HOUGHTON MIFFLIN HARCOURT
Publisher:
Houghton Mifflin Harcourt
Holt Mcdougal Larson Pre-algebra: Student Edition…
Algebra
ISBN:
9780547587776
Author:
HOLT MCDOUGAL
Publisher:
HOLT MCDOUGAL