1. Fill in the blank: For these data, values for rental revenue that are less than the mean of the values for rental revenue tend to be paired with values for theater revenue that are. the mean of the values for theater revenue. 2. Fill in the blank: According to the regression equation, for an increase of one million dollars in theater revenue, there is a corresponding of 0.15 million dollars in rental revenue. 3. What was the observed rental revenue (in millions of dollars) when the theater revenue was 61.5 million dollars? 4. From the regression equation, what is the predicted rental revenue (in millions of dollars) when the theater revenue is 61.5 million dollars? (Round your answer to at least one decimal place.)
1. Fill in the blank: For these data, values for rental revenue that are less than the mean of the values for rental revenue tend to be paired with values for theater revenue that are. the mean of the values for theater revenue. 2. Fill in the blank: According to the regression equation, for an increase of one million dollars in theater revenue, there is a corresponding of 0.15 million dollars in rental revenue. 3. What was the observed rental revenue (in millions of dollars) when the theater revenue was 61.5 million dollars? 4. From the regression equation, what is the predicted rental revenue (in millions of dollars) when the theater revenue is 61.5 million dollars? (Round your answer to at least one decimal place.)

College Algebra
7th Edition
ISBN:9781305115545
Author:James Stewart, Lothar Redlin, Saleem Watson
Publisher:James Stewart, Lothar Redlin, Saleem Watson
Chapter1: Equations And Graphs
Section: Chapter Questions
Problem 10T: Olympic Pole Vault The graph in Figure 7 indicates that in recent years the winning Olympic men’s...

Related questions
Question
100%
I keep getting the answers incorrect.
Transcribed Image Text:12:10
AA
www-awn.aleks.com
O REGRESSION AND CORRELATION
Predictions from the least-.
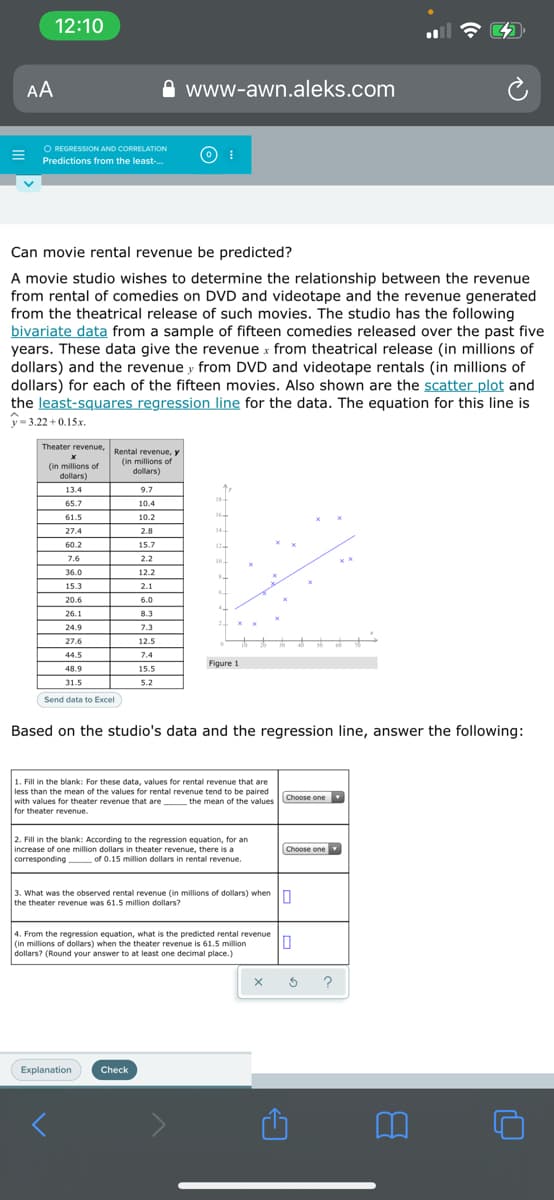
Can movie rental revenue be predicted?
A movie studio wishes to determine the relationship between the revenue
from rental of comedies on DVD and videotape and the revenue generated
from the theatrical release of such movies. The studio has the following
bivariate data from a sample of fifteen comedies released over the past five
years. These data give the revenue x from theatrical release (in millions of
dollars) and the revenue y from DVD and videotape rentals (in millions of
dollars) for each of the fifteen movies. Also shown are the scatter plot and
the least-squares regression line for the data. The equation for this line is
y- 3,22 +0.15 x.
Theater revenue,
Rental revenue, y
(in millions of
dollars)
(in millions of
dollars)
13.4
9.7
65.7
10.4
16
61.5
10.2
27.4
2.8
14
60.2
15.7
12
7.6
2.2
10
36.0
12.2
15.3
2.1
20.6
6.0
26.1
8.3
24.9
7.3
27.6
12.5
44.5
7.4
Figure 1
48.9
15.5
31.5
5.2
Send data to Excel
Based on the studio's data and the regression line, answer the following:
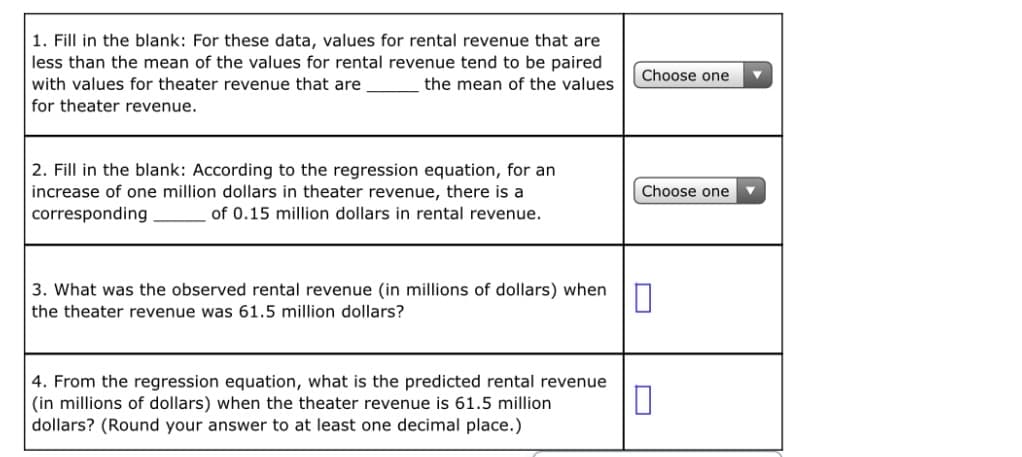
1. Fill in the blank: For these data, values for rental revenue that are
less than the mean of the values for rental revenue tend to be paired
with values for theater revenue that are the mean of the values
for theater revenue.
Choose one
2. Fill in the blank: According to the regression equation, for an
increase of one million dollars in theater revenue, there is a
corresponding of 0.15 million dollars in rental revenue.
Choose one
3. What was the observed rental revenue (in millions of dollars) when In
the theater revenue was 61.5 million dollars?
4. From the regression equation, what is the predicted rental revenue
(in millions of dollars) when the theater revenue is 61.5 million
dollars? (Round your answer to at least one decimal place.)
?
Explanation
Check
Transcribed Image Text:1. Fill in the blank: For these data, values for rental revenue that are
less than the mean of the values for rental revenue tend to be paired
Choose one
with values for theater revenue that are
the mean of the values
for theater revenue.
2. Fill in the blank: According to the regression equation, for an
Choose one
increase of one million dollars in theater revenue, there is a
corresponding
of 0.15 million dollars in rental revenue.
3. What was the observed rental revenue (in millions of dollars) when
the theater revenue was 61.5 million dollars?
4. From the regression equation, what is the predicted rental revenue
(in millions of dollars) when the theater revenue is 61.5 million
dollars? (Round your answer to at least one decimal place.)
Expert Solution
This question has been solved!
Explore an expertly crafted, step-by-step solution for a thorough understanding of key concepts.

This is a popular solution!

Trending now
This is a popular solution!

Step by step
Solved in 2 steps

Knowledge Booster


Learn more about
Need a deep-dive on the concept behind this application? Look no further. Learn more about this topic, statistics and related others by exploring similar questions and additional content below.Recommended textbooks for you
College Algebra
Algebra
ISBN:
9781305115545
Author:
James Stewart, Lothar Redlin, Saleem Watson
Publisher:
Cengage Learning

Linear Algebra: A Modern Introduction
Algebra
ISBN:
9781285463247
Author:
David Poole
Publisher:
Cengage Learning

Glencoe Algebra 1, Student Edition, 9780079039897…
Algebra
ISBN:
9780079039897
Author:
Carter
Publisher:
McGraw Hill
College Algebra
Algebra
ISBN:
9781305115545
Author:
James Stewart, Lothar Redlin, Saleem Watson
Publisher:
Cengage Learning
Linear Algebra: A Modern Introduction
Algebra
ISBN:
9781285463247
Author:
David Poole
Publisher:
Cengage Learning
Glencoe Algebra 1, Student Edition, 9780079039897…
Algebra
ISBN:
9780079039897
Author:
Carter
Publisher:
McGraw Hill