1. Find the Mean and Mode of the following data that the mass of certain worms Mass [1.2-1.5) [1.6-1.9) [2.0-2.3) [2.4-2.7) [2.8-3.1) [3.2-3.5) Frequency 4 2 6 3 1 5
1. Find the Mean and Mode of the following data that the mass of certain worms Mass [1.2-1.5) [1.6-1.9) [2.0-2.3) [2.4-2.7) [2.8-3.1) [3.2-3.5) Frequency 4 2 6 3 1 5

Glencoe Algebra 1, Student Edition, 9780079039897, 0079039898, 2018
18th Edition
ISBN:9780079039897
Author:Carter
Publisher:Carter
Chapter10: Statistics
Section10.5: Comparing Sets Of Data
Problem 14PPS

Related questions
Question
Hi i’m in grade 12 Data Management and i need help with this practice question
please use one and two variable statistic methods
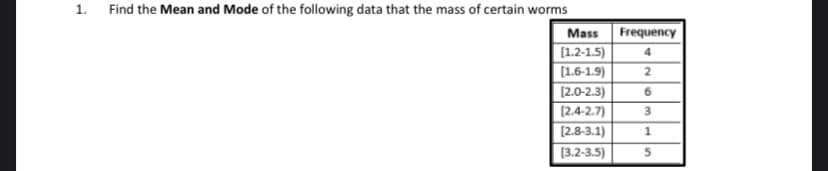
Transcribed Image Text:1.
Find the Mean and Mode of the following data that the mass of certain worms
Mass
[1.2-1.5)
[1.6-1.9)
[2.0-2.3)
[2.4-2.7)
[2.8-3.1)
[3.2-3.5)
Frequency
4
2
6
3
1
5
Expert Solution
This question has been solved!
Explore an expertly crafted, step-by-step solution for a thorough understanding of key concepts.

Step by step
Solved in 2 steps with 2 images

Recommended textbooks for you
Glencoe Algebra 1, Student Edition, 9780079039897…
Algebra
ISBN:
9780079039897
Author:
Carter
Publisher:
McGraw Hill
Glencoe Algebra 1, Student Edition, 9780079039897…
Algebra
ISBN:
9780079039897
Author:
Carter
Publisher:
McGraw Hill