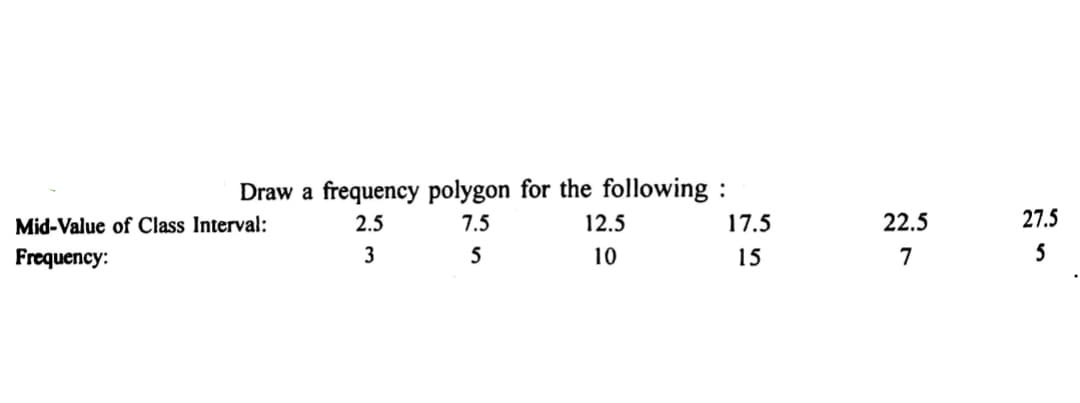
Draw a frequency polygon for the following: 2.5 7.5 3 5 Mid-Value of Class Interval: Frequency: 12.5 10 17.5 15 22.5 7 27.5 5


Q: An example of nominal data is O number of students Number of correct answers Hair color None
A: Nominal data: Nominal data measure qualitative data and it is the name of variable. example: Hair…
Q: a ould Select an answer th lusion is that ... gest the population mean is tically significant…
A: * Hi! Thank you for the question, As per the honour code, we are allowed to answer three sub-parts…
Q: Draw a percentile curve for the following distribution of marks obtained by 700 students at an…
A: First calculate the percentile by the formula.
Q: olio. select stocks from EGYX30 and get their actual return, Calculate their Coefficient of variance…
A: Note: As the question has multiple subparts according to the company guidelines first 3 questions…
Q: b) Let Zi σχ dy i) State, with parameter(s), the probability distribution of the statistic, T = ii)…
A: As per bartleby guidelines we can solve only first three subparts and rest can be reposted
Q: Sleep apnea is a sleep disorder characterized by pauses in breathing during sleep. Children with…
A: Given Information: Consider the sample mean and squared deviations for each of the three groups:…
Q: Consider a random variable X and the following probability distribution. P(X=12) = 0.0405 P(X = 33)…
A:
Q: 5. In the United States, there is a strong relationship between education and smoking: well-educated…
A: The researcher recorded the level of education and smoking status of a random sample of 459 French…
Q: The number of cans of soft drinks sold in a machine each week is recorded below. Develop forecasts…
A: Given Sales of cans of softdrinks for week We have to calculate forcast for week 10 and mean…
Q: ht bulb manufacturer wants to compare the mean lifetimes of two of its light bulbs, model A and…
A: Given that Sample sizes n1=11 , n2=13 Sample means X̄1=1323 , X̄2=1366 s1 =95…
Q: At a drug rehab center 40% experience depression and 28% experience weight gain. 14% experience…
A: As per our guidelines I can solve only first 3 subparts. Post the remaining subparts again and…
Q: (a) The process standard deviation is 0.30, and the process control is set at plus or minus one…
A: Given data : p=1000 Mean μ=10,Standard deviation σ=0.30
Q: 3. In the linear regression model Y₁ Bo+B₁X₁+Ei, an alternate estimator Y Â₁=X. State all the CLRM…
A: x explanatory variable y Dependent variable The equation of the linear model is y = β0+β1xi+εi…
Q: In a survey of 2549 adults in a recent year, 1270 say they have made a New Year's resolution.…
A:
Q: Marks on a test are out of 40. The mean mark is 28 with standard deviation 5. Marks have t be…
A:
Q: An instructor gives four 1-hour exams and one final exam, which counts as two 1-hour exams. Find a…
A: There are four 1-hour exams. Grades in 1-hour exam: 62, 83, 97, 90 There is one final exam,…
Q: 1. Assume Gauss-Markov assumptions hold. Prove the OLS estimator of Bo is consistent. Using…
A:
Q: Let X₁, X2, X3,..., X30 be a random sample of size 30 from a population distributed with the…
A:
Q: Find the mean, median, and mode for the following data set. Round your answers to one decimal place,…
A: Given data: 11, 24, 24, -13, 14
Q: The mean SAT score in mathematics is 513. The standard deviation of these scores is 49. A special…
A: The random variable SAT score follows normal distribution. We have to test whether the population…
Q: One variable A. 3 moments, calculation and definition B. Normal distribution density function C.…
A: Since you have asked multiple question, we will solve the first question for you. If youwant any…
Q: The binomial distribution is used when there are exactly two mutally exclusive outcomes of a trial.…
A: The following information has been given: The probability of success is p=0.5. The probability of…
Q: a) b) c) Show that for any &> 0 and S, ===₁ X₁, lim P(|S₁ − 0| ≥ ɛ) = 0. 1110 Show that a statistic…
A: As per bartleby guidelines we can solve only first three subparts and rest can be reposted
Q: In a normal distribution, x = 5 and z = –1.4. This tells you that x = 5 is ____ standard deviations…
A: Given that Z-score = -1.4 and x=5
Q: Use the given confidence interval to find the margin of error and the sample mean. (13.3,22.9)
A:
Q: Suppose that a sequence of mutually independent and identically distributed discrete random…
A: Note: Hi! Thank you for your question. As per the guideline we can solve three subparts at a time in…
Q: 1) Let X₁, X2, X3, ... Xn be a sequence of independent and identically distributed with the…
A: Given pdf f(x;θ)=1/√(2π)e^(-1/2(x-θ)2) Note: According to Bartleby guidelines expert solve only…
Q: While it is known from data on national sales that 25% of cars sold are sedans, a survey in one city…
A: We define the parameter and statistics as : The parameters are the summaries of the data for the…
Q: The rapid growth video game popularity has generate concern among practitioners, parents scholars…
A: Given: Sample size n=52 The two variables under study are: The amount of time girls spend playing…
Q: a. For this study, we should use Select an answer b. The null and alternative hypotheses would be:…
A: Given that n = 337 , X = 24 , p = 12% = 0.12 Note : According to bartleby experts question answers…
Q: Suppose 226 subjects are treated with a drug that is used to treat pain and 54 of them developed…
A: Given Information: Sample size n=226 users x=54 of them developed nausea. Significance level α=0.10…
Q: John hands out survey forms to his classmates to be returned to him next week. It is an example of…
A: Sampling Bias: Sampling bias is committed when not all the population have equal probability of…
Q: 4. What is the name of the additional variance that we can 'factor out' in repeated measures ANOVA?
A: the additional variances that we factor out in repeated measures ANOVA is 'within subject'
Q: 7) Suggest an appropriate specification of ARMA model for the data, for which the following results…
A: The objective is to identify the suitable ARMA model of order (p,q) using the given ACF and PACF…
Q: Study the partial ANOVA. ANOVA df Regression a Residual b Total 29 SS 4516.804 743.062 5259.866 MS…
A: Since you have posted a question with multiple sub-parts, we will solve first 3 subparts for you. To…
Q: Consider the following sample with 20 observations: 1 1 5 7 9 11 11 14 14 19 20…
A: Sol:- Interquartile RangeThe interquartile range is the difference of the first and third…
Q: What is the standard deviation of 32, 21, 17, 38 and 6.
A:
Q: Suppose that a sequence of mutually independent and identically distributed discrete random…
A: Given X~Pois(θ)
Q: of 85 83 80 F-value n₁²5 m₂ = N = 12 Critical Value / Tabular Value
A: The ANOVA test is used to compare the means of different groups while employing specific estimate…
Q: what should the reorder point be
A: From given data we have: Average Demand per week (D) =11240 Standard deviation (σd)= 2947 Lead time…
Q: A process of drawing a sample is called Sampling Census Both none
A: Given that Simple random sampling: A procedure for selecting a sample of size n out of a finite…
Q: biologist looked at the relationship between humb of seeds a plant produces and the percent of those…
A: x y xi-x yi-y (xi-x)2 (yi-y)2 (xi-x)(yi-y) 636956594061414545 47.544.54760.57354.569.556.570.5…
Q: Let X₁, X2, X3, X30 be a random sample of size 30 from a population distributed with the following…
A: Since you have asked multiple question, according to our guidelines we will solve the first question…
Q: Let Zi X₁μx~N(0,1), and Wi = ~N(0,1), for i = 1,2,3,...,10, then: i) State, with parameter(s), the…
A:
Q: 1. Consider the population consisting of the values (1, 3, 8). a. List all the possible samples of…
A: Given Sample: {1,3,8} Note: According to Bartleby guidelines expert solve only one question and…
Q: It is projected that approximately 580,000 veterans will take advantage of the GI Bill for the 21st…
A: Given that: Source SS df MS F Between Treatments 1040 7 Factor A 500 1 500 8.49 Factor…
Q: You are about to collect data on rabbits, to estimate their mean ear length. The population follows…
A: Given that: Standard deviation = 0.4 cm Margin of error = 0.2 cm Confidence level = 95 % To find:…
Q: Assume that MLR1-6 hold. We can say that the coefficient is statistically significant at the 5%…
A: Introduction: It is required to identify the statement as true or false.
Q: QUESTION 15 If the coefficient of determination is 0.15 and the total sum of squares is 838, find…
A:
Q: Johnson Wholesale Company manufactures a variety of products. The prices and quantities produced for…
A: From the given information 2010 is the base period and 2019 is the current period. Let P0 be the…

Step by step
Solved in 2 steps with 1 images

- Use theorem 5.4.3 to form a proportion in which TS is a geometric mean. Hint: TVSTSR Exercises 1-6The following frequency distribution shows the length (in feet) of the main spans of the longest suspension bridges in the United States. Construct a frequency polygon. Class limits Frequency 1265 – 1723 12 1724 – 2182 5 2183 – 2641 4 2642 – 3100 2 3101 – 3559 1 3560 – 4018 1 Total 25TABULATE THE FOLLOWING MARKS IN GROUPED FREQUENCY DISTRIBUTION
- Consider the following frequency table representing the distribution of the length of a morning walk with the dog in miles. Determine the midpoint for the 3rd classClassify the following data: The type of palm trees on the island of Oahu. Nominal Ordinal Interval RatioState the reason why the following frequency distribution is incorrectly constructed.Class Frequency45-50 350-55 055-60 660-65 565-70 3
- Use the data above to construct a grouped frequency table with the following column I)Class intervals II)Class boundaries III)Class marks IV) Frequency C)Draw a frequency polygon for the distributionDraw a frequency polygon based on the data.Place the following set of n=20 scores in a FREQUENCY distrubution table
- Construct the following with the numbers in the image 1. A frequency distribution 2. A reletive frequency distribution 3. A histogram 4. A frequency polygonConsider a frequency table that has 5 classes. The boundaries for class 1 are 0.9005 and 19.2545. What is the largest possible value in class 1?Use the data set and cutpoint grouping with a first cutpoint of 25 and a class width of 3. Determine a frequency distribution.
