1. Gather the height (in inches) of at least 10 male and 10 female classmates. I. Tally the result using Frequency table (ungrouped) Example: Height (in inches) Frequency 59 60 64 4 ... ... I. Compute the Measures of Central Tendency (Mean, Median, Mode) of the two groups (ma and Female) IV, Compute the Variance, Standard Deviation and Coefficient of Variation (use data as a sample of the two groups (male and Female) V. Make a conclusion based from the computed results of IV and V
1. Gather the height (in inches) of at least 10 male and 10 female classmates. I. Tally the result using Frequency table (ungrouped) Example: Height (in inches) Frequency 59 60 64 4 ... ... I. Compute the Measures of Central Tendency (Mean, Median, Mode) of the two groups (ma and Female) IV, Compute the Variance, Standard Deviation and Coefficient of Variation (use data as a sample of the two groups (male and Female) V. Make a conclusion based from the computed results of IV and V

Glencoe Algebra 1, Student Edition, 9780079039897, 0079039898, 2018
18th Edition
ISBN:9780079039897
Author:Carter
Publisher:Carter
Chapter10: Statistics
Section10.6: Summarizing Categorical Data
Problem 23PPS

Related questions
Question
100%
Transcribed Image Text:eTask x
b DIRECTIONS: Assume that you a x +
2%20Final%20Performance%20Task%20(1).pdf
mboard_ULS
Post Attendee - Zo. Voting
O OVERVIEW OF TOU. h What is another wo.
1/1
100%
+
Fit to page
1.
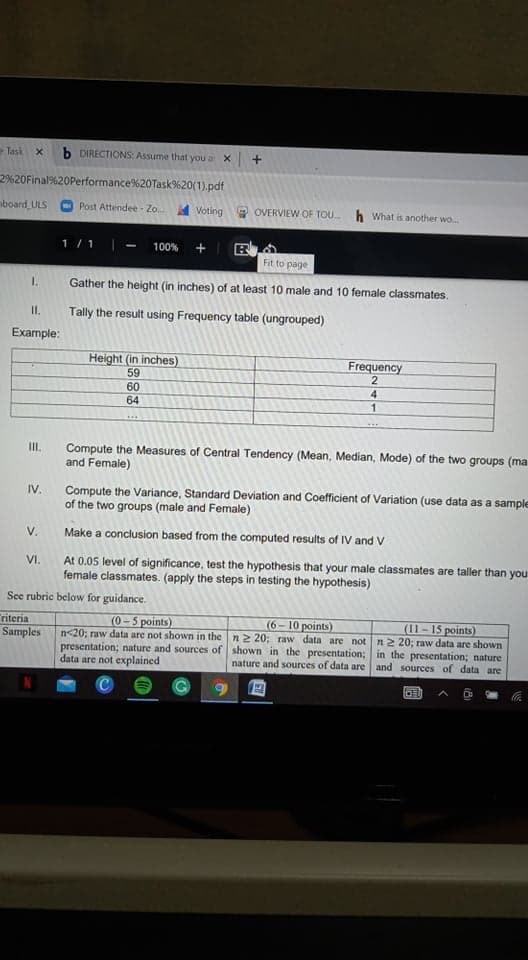
Gather the height (in inches) of at least 10 male and 10 female classmates.
I.
Tally the result using Frequency table (ungrouped)
Example:
Height (in inches)
59
Frequency
2
60
4
64
...
Compute the Measures of Central Tendency (Mean, Median, Mode) of the two groups (ma
and Female)
II.
Compute the Variance, Standard Deviation and Coefficient of Variation (use data as a sample
of the two groups (male and Female)
IV.
V.
Make a conclusion based from the computed results of IV and V
At 0.05 level of significance, test the hypothesis that your male classmates are taller than you
female classmates. (apply the steps in testing the hypothesis)
VI.
See rubric below for guidance.
Triteria
Samples
(6-10 points)
n<20; raw data are not shown in the n 2 20; raw data are not n2 20; raw data are shown
presentation; nature and sources of shown in the presentation; in the presentation; nature
nature and sources of data are
(0-5 points)
(11-15 points)
data are not explained
and sources of data are
Expert Solution
This question has been solved!
Explore an expertly crafted, step-by-step solution for a thorough understanding of key concepts.

This is a popular solution!

Trending now
This is a popular solution!

Step by step
Solved in 7 steps with 7 images

Recommended textbooks for you
Glencoe Algebra 1, Student Edition, 9780079039897…
Algebra
ISBN:
9780079039897
Author:
Carter
Publisher:
McGraw Hill

Holt Mcdougal Larson Pre-algebra: Student Edition…
Algebra
ISBN:
9780547587776
Author:
HOLT MCDOUGAL
Publisher:
HOLT MCDOUGAL
Glencoe Algebra 1, Student Edition, 9780079039897…
Algebra
ISBN:
9780079039897
Author:
Carter
Publisher:
McGraw Hill
Holt Mcdougal Larson Pre-algebra: Student Edition…
Algebra
ISBN:
9780547587776
Author:
HOLT MCDOUGAL
Publisher:
HOLT MCDOUGAL