1. Here is a chart of the National Parks in the United States. Find the Mean, Median, Mode and Mid-Range of this data. Show your work. If you use a calculator explain the steps you took. If you use excel, submit your spreadsheet.

Glencoe Algebra 1, Student Edition, 9780079039897, 0079039898, 2018
18th Edition
ISBN:9780079039897
Author:Carter
Publisher:Carter
Chapter10: Statistics
Section10.3: Measures Of Spread
Problem 8PPS
icon
Related questions
icon
Concept explainers
Topic Video
Question
Page <
> of 4
ZOOM +
hame
date
1. Here is a chart of the National Parks in the United States. Find the Mean, Median,
Mode and Mid-Range of this data. Show your work. If you use a calculator explain
the steps you took. If you use excel, submit your spreadsheet.
No.
No.
National
State
National State
Parks
Parks
Maine
8
1
Alaska
Michigan
8.
Califomia
Minnesota
1
Utah
Montana
1
Colorado
Nevada
Arizona
Florida
New Mexico 1
3
North
Washington
Carolina
3
North
Dakota
1
Hawaii
South
Ohio
Dakota
Texas
Oregon
2
South
Wyoming
Carolina
2
1
Tennessee
1
Arkansas
Virginia
1
Kentucky
2. Pick one of the four "measure of average" and explain a situation which would cause
it to NOT be a good choice for indicating the average. (mean, median, mode, mid-
range)
Page 1 of 4
Transcribed Image Text:Page < > of 4 ZOOM + hame date 1. Here is a chart of the National Parks in the United States. Find the Mean, Median, Mode and Mid-Range of this data. Show your work. If you use a calculator explain the steps you took. If you use excel, submit your spreadsheet. No. No. National State National State Parks Parks Maine 8 1 Alaska Michigan 8. Califomia Minnesota 1 Utah Montana 1 Colorado Nevada Arizona Florida New Mexico 1 3 North Washington Carolina 3 North Dakota 1 Hawaii South Ohio Dakota Texas Oregon 2 South Wyoming Carolina 2 1 Tennessee 1 Arkansas Virginia 1 Kentucky 2. Pick one of the four "measure of average" and explain a situation which would cause it to NOT be a good choice for indicating the average. (mean, median, mode, mid- range) Page 1 of 4
Expert Solution
Step 1

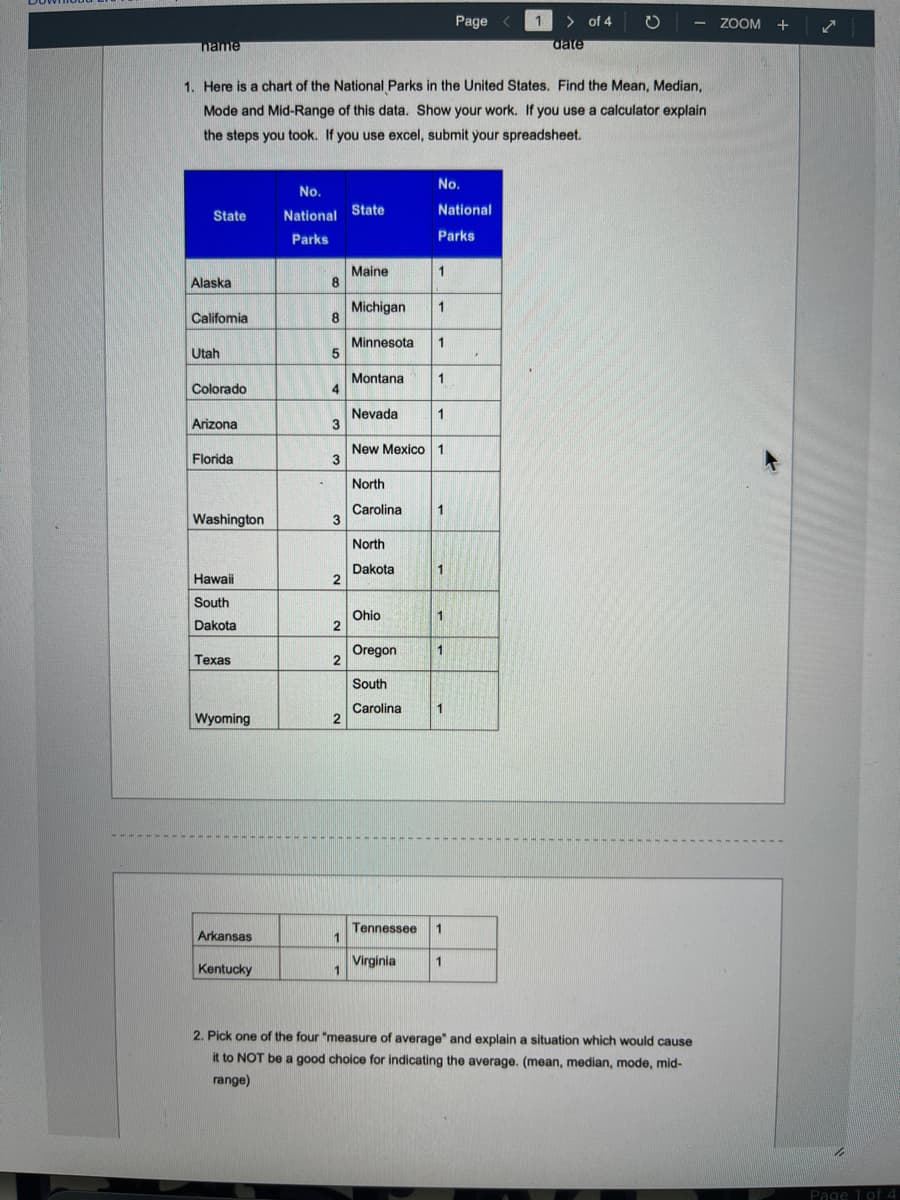
The data of National Parks in United States is given.

Mean is sum of observations divided by number of observations. The median is the middlemost value of the observations, mode is the number which is repeated maximum number of times and mid-range is average of value of maximum observation and minimum observation from the data set.  

trending now

Trending now

This is a popular solution!

steps

Step by step

Solved in 2 steps with 4 images

Blurred answer
Knowledge Booster
Centre, Spread, and Shape of a Distribution
Learn more about
Need a deep-dive on the concept behind this application? Look no further. Learn more about this topic, statistics and related others by exploring similar questions and additional content below.
Recommended textbooks for you
Glencoe Algebra 1, Student Edition, 9780079039897…
Algebra
ISBN:
9780079039897
Author:
Carter
Publisher:
McGraw Hill
Big Ideas Math A Bridge To Success Algebra 1: Stu…
Algebra
ISBN:
9781680331141
Author:
HOUGHTON MIFFLIN HARCOURT
Publisher:
Houghton Mifflin Harcourt
Holt Mcdougal Larson Pre-algebra: Student Edition…
Algebra
ISBN:
9780547587776
Author:
HOLT MCDOUGAL
Publisher:
HOLT MCDOUGAL