1. How do you think a cell performing cellular respiration rids itself of the resulting CO,? 2. WHAT IF? > If a Paramecium swims from a hypotonic to an isotonic environment, will its contractile vacuole become more active or less? Why?
1. How do you think a cell performing cellular respiration rids itself of the resulting CO,? 2. WHAT IF? > If a Paramecium swims from a hypotonic to an isotonic environment, will its contractile vacuole become more active or less? Why?

Biology Today and Tomorrow without Physiology (MindTap Course List)
5th Edition
ISBN:9781305117396
Author:Cecie Starr, Christine Evers, Lisa Starr
Publisher:Cecie Starr, Christine Evers, Lisa Starr
Chapter7: Gene Expression And Control
Section: Chapter Questions
Problem 1DID

Related questions
Question
Transcribed Image Text:om either a 15-day-old
1-old guinea pig.
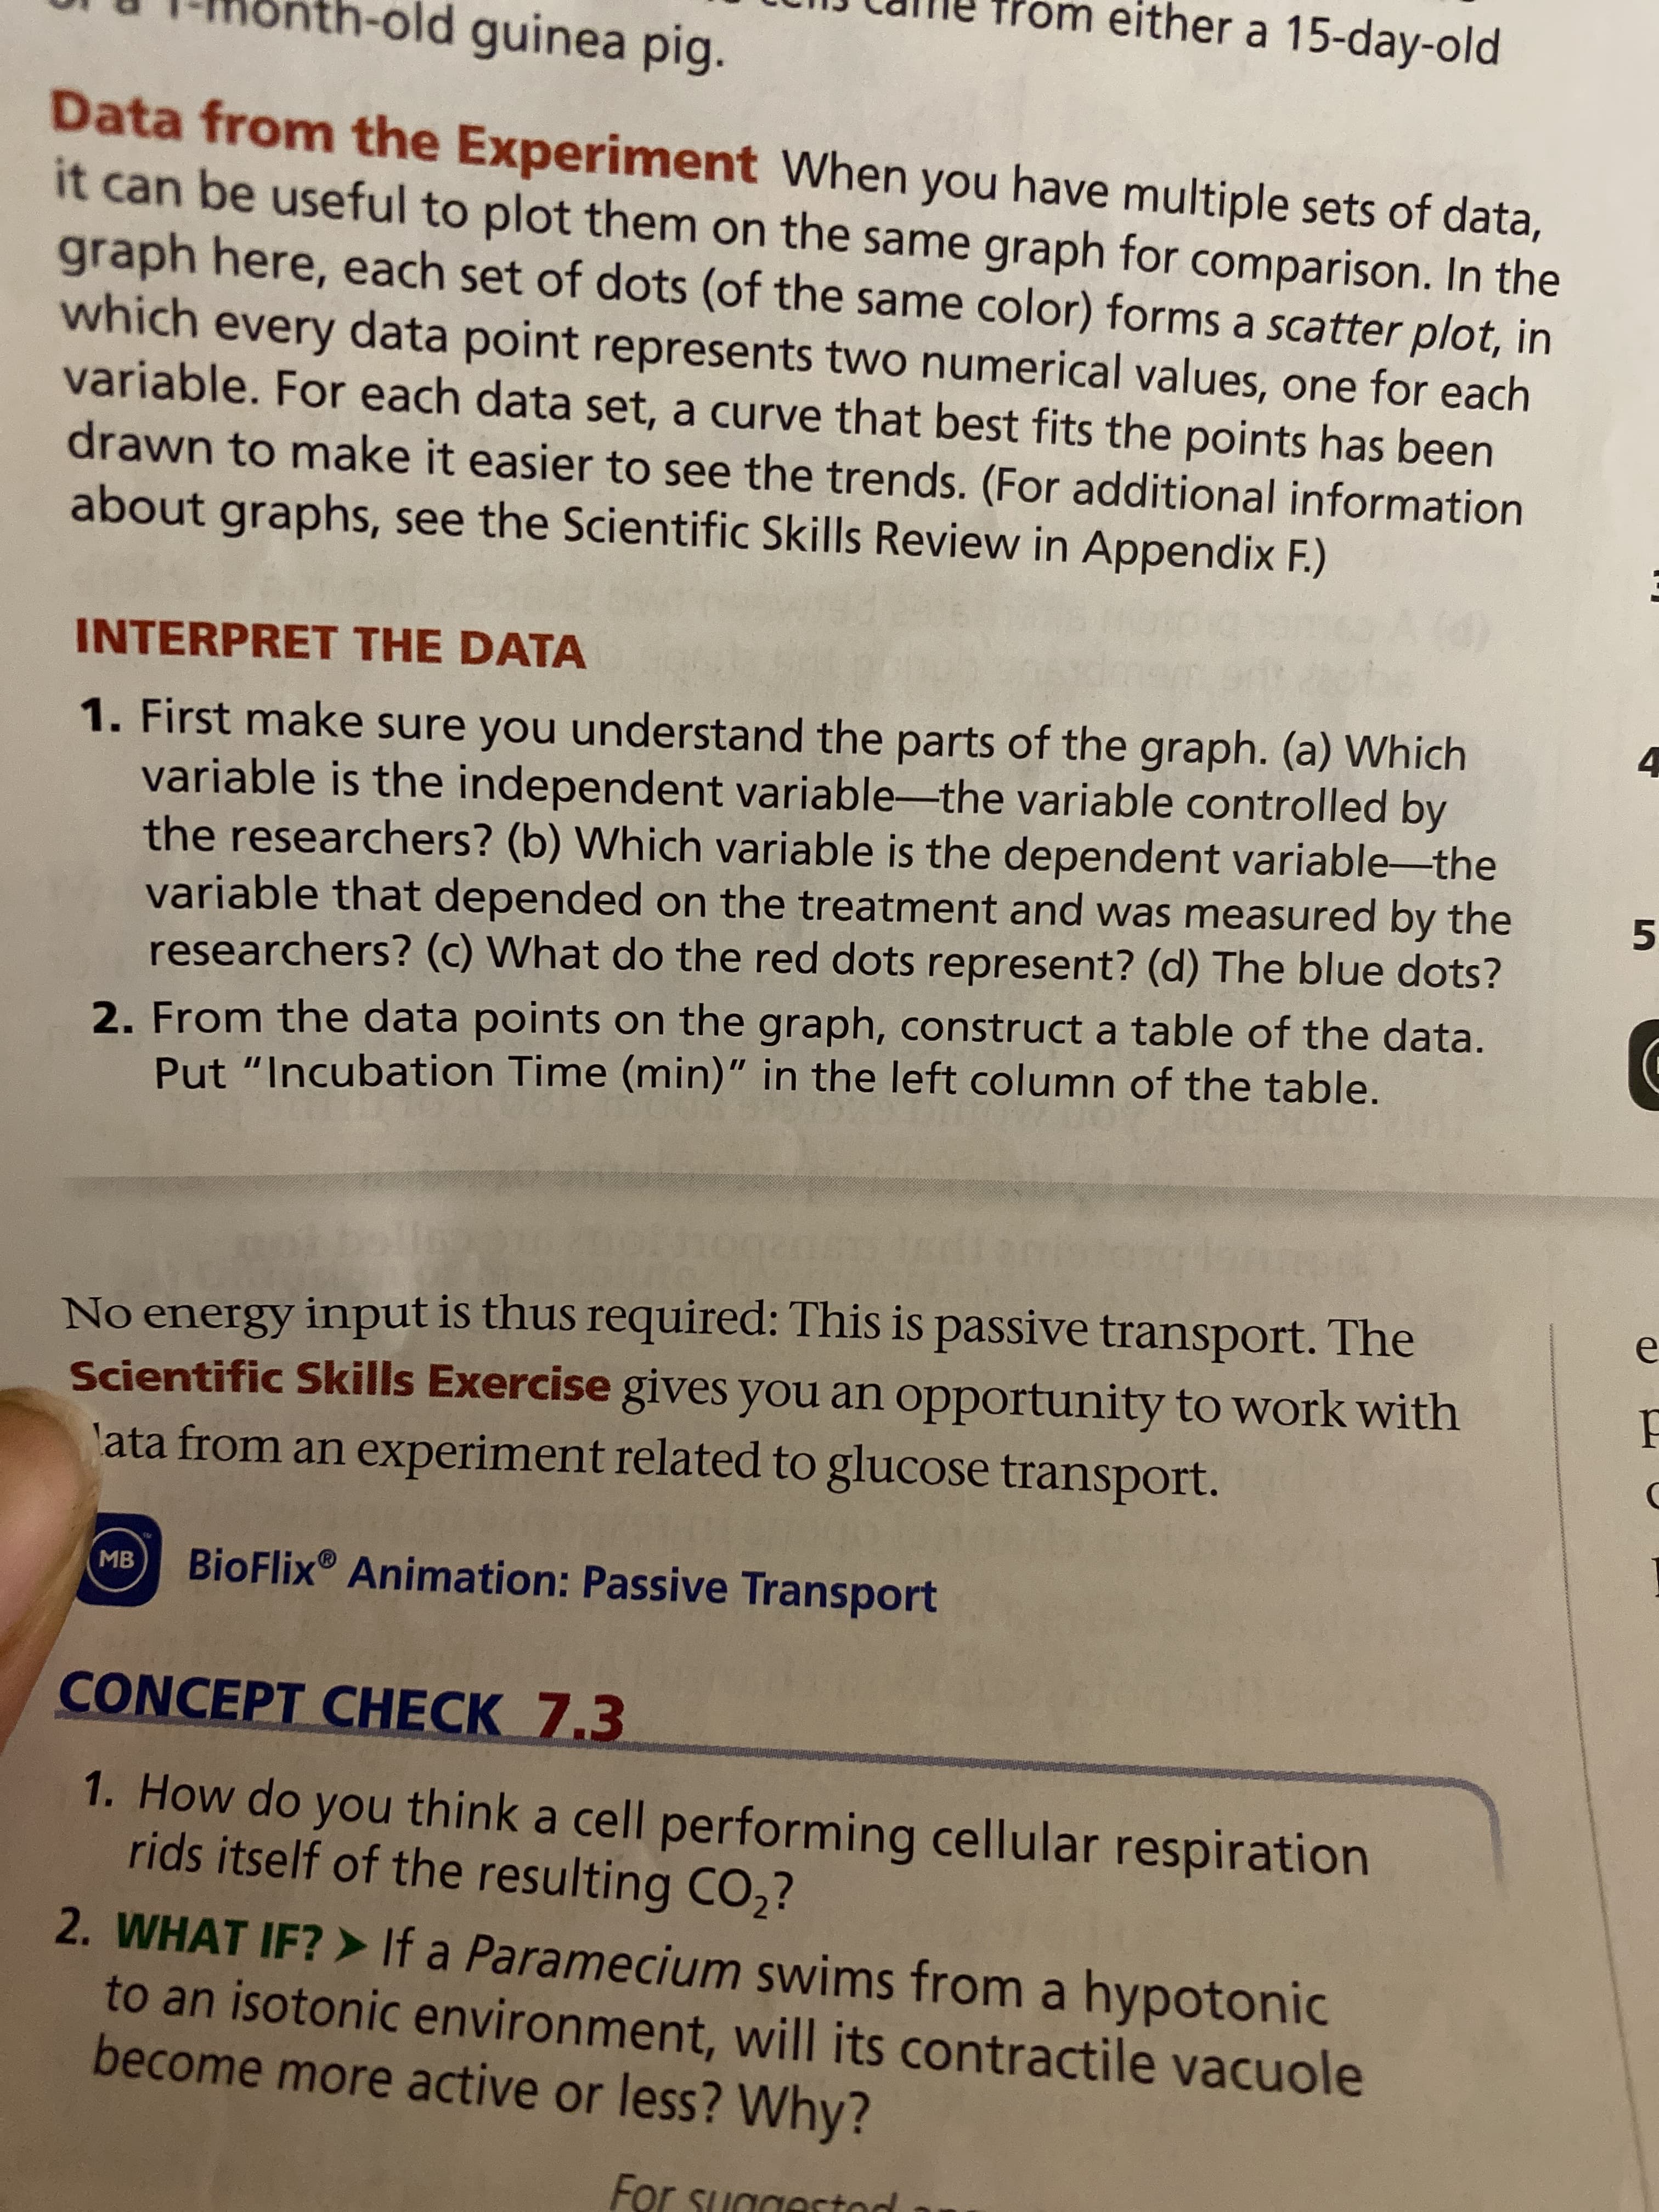
Data from the Experiment When you have multiple sets of data,
it can be useful to plot them on the same graph for comparison. In the
graph here, each set of dots (of the same color) forms a scatter plot, in
which every data point represents two numerical values, one for each
variable. For each data set, a curve that best fits the points has been
drawn to make it easier to see the trends. (For additional information
about graphs, see the Scientific Skills Review in Appendix F.)
INTERPRET THE DATA
1. First make sure you understand the parts of the graph. (a) Which
variable is the independent variable-the variable controlled by
the researchers? (b) Which variable is the dependent variable-the
variable that depended on the treatment and was measured by the
researchers? (c) What do the red dots represent? (d) The blue dots?
2. From the data points on the graph, construct a table of the data.
Put "Incubation Time (min)" in the left column of the table.
No energy input is thus required: This is passive transport. The
Scientific Skills Exercise gives you an opportunity to work with
lata from an experiment related to glucose transport.
BioFlix® Animation: Passive Transport
MB
CONCEPT CHECK 7.3
1. How do you think a cell performing cellular respiration
rids itself of the resulting CO,?
2. WHAT IF? > If a Paramecium swims from a hypotonic
to an isotonic environment, will its contractile vacuole
become more active or less? Why?
Expert Solution
This question has been solved!
Explore an expertly crafted, step-by-step solution for a thorough understanding of key concepts.

This is a popular solution!

Trending now
This is a popular solution!

Step by step
Solved in 2 steps

Recommended textbooks for you
Biology Today and Tomorrow without Physiology (Mi…
Biology
ISBN:
9781305117396
Author:
Cecie Starr, Christine Evers, Lisa Starr
Publisher:
Cengage Learning

Human Heredity: Principles and Issues (MindTap Co…
Biology
ISBN:
9781305251052
Author:
Michael Cummings
Publisher:
Cengage Learning

Biology Today and Tomorrow without Physiology (Mi…
Biology
ISBN:
9781305117396
Author:
Cecie Starr, Christine Evers, Lisa Starr
Publisher:
Cengage Learning
Human Heredity: Principles and Issues (MindTap Co…
Biology
ISBN:
9781305251052
Author:
Michael Cummings
Publisher:
Cengage Learning
Case Studies In Health Information Management
Biology
ISBN:
9781337676908
Author:
SCHNERING
Publisher:
Cengage