1. Identify the parameter of interest. Describe it in the context of the situation. 2. Determine null value and state null hypothesis. 3. State the appropriate alternative hypothesis. 4. Give the formula for the computed value of the test statistic. 5. State the rejection region for the selected level of significance, a. 6. Compute sample quantities (if necessary), substitute into formula for the test statistic value, and compute that value (z in this case). 7. Decide whether or not the null hypothesis should be rejected and state the conclusion in the context of the original problem. (Either "reject" or "fail to reject the null hypothesis; never "accept" the null hypothesis. Next, explain what this means in terms of your specific situation, e.g., "conclude that the mean sulfur content is greater than 1.50%.") For the problems below, when asked to conduct the hypothesis test, please use the seven-step process we have been using in class. Also, in step 7, it is very important to be clear in your conclusion. There are three parts to this: evidence from your hypothesis test, the decision to reject or fail to reject the null hypothesis, and the conclusion in the context of the problem. For example, referring to the first example we did in Chapter 10, we stated the following "-1.03 is not less than -1.96, nor is it greater than +1.96, so we fail to reject Ho: Hi - 2 0, and conclude that there is no difference in mean yield strength between the two types of roof bolts." (Here, the evidence is -1.03 is not less than -1.96, nor is it greater than +1.96 The decision is We fail to reject Ho: H1-2 = 0 The conclusion in the context of the problem is We conclude that there is no difference in mean yield strength between the two types of roof bolts) A study was performed to determine whether men and women differ in repeatability in 6. assembling components on printed circuit boards. Random samples of 25 men and 21 women were selected, and each subject assembled the units. The two sample standard deviations of assembly time were smen = 0.98 minutes and swomen 1.02 minutes. (a) Use the seven-step hypothesis test that we have been using in class to determine if men and women differ in repeatability for this assembly task. Use a = 0.02 and state any necessary assumptions about the underlying distribution of the data. Do not use the P-Value. (b) Determine a 98% confidence interval on the ratio of the two variances. interpretation of the interval Provide an
1. Identify the parameter of interest. Describe it in the context of the situation. 2. Determine null value and state null hypothesis. 3. State the appropriate alternative hypothesis. 4. Give the formula for the computed value of the test statistic. 5. State the rejection region for the selected level of significance, a. 6. Compute sample quantities (if necessary), substitute into formula for the test statistic value, and compute that value (z in this case). 7. Decide whether or not the null hypothesis should be rejected and state the conclusion in the context of the original problem. (Either "reject" or "fail to reject the null hypothesis; never "accept" the null hypothesis. Next, explain what this means in terms of your specific situation, e.g., "conclude that the mean sulfur content is greater than 1.50%.") For the problems below, when asked to conduct the hypothesis test, please use the seven-step process we have been using in class. Also, in step 7, it is very important to be clear in your conclusion. There are three parts to this: evidence from your hypothesis test, the decision to reject or fail to reject the null hypothesis, and the conclusion in the context of the problem. For example, referring to the first example we did in Chapter 10, we stated the following "-1.03 is not less than -1.96, nor is it greater than +1.96, so we fail to reject Ho: Hi - 2 0, and conclude that there is no difference in mean yield strength between the two types of roof bolts." (Here, the evidence is -1.03 is not less than -1.96, nor is it greater than +1.96 The decision is We fail to reject Ho: H1-2 = 0 The conclusion in the context of the problem is We conclude that there is no difference in mean yield strength between the two types of roof bolts) A study was performed to determine whether men and women differ in repeatability in 6. assembling components on printed circuit boards. Random samples of 25 men and 21 women were selected, and each subject assembled the units. The two sample standard deviations of assembly time were smen = 0.98 minutes and swomen 1.02 minutes. (a) Use the seven-step hypothesis test that we have been using in class to determine if men and women differ in repeatability for this assembly task. Use a = 0.02 and state any necessary assumptions about the underlying distribution of the data. Do not use the P-Value. (b) Determine a 98% confidence interval on the ratio of the two variances. interpretation of the interval Provide an

MATLAB: An Introduction with Applications
6th Edition
ISBN:9781119256830
Author:Amos Gilat
Publisher:Amos Gilat
Chapter1: Starting With Matlab
Section: Chapter Questions
Problem 1P

Related questions

Topic Video
Question
THIS NOT GRADED ASSIGIMENT , IT IS AN OLD EXAM QUESTION.
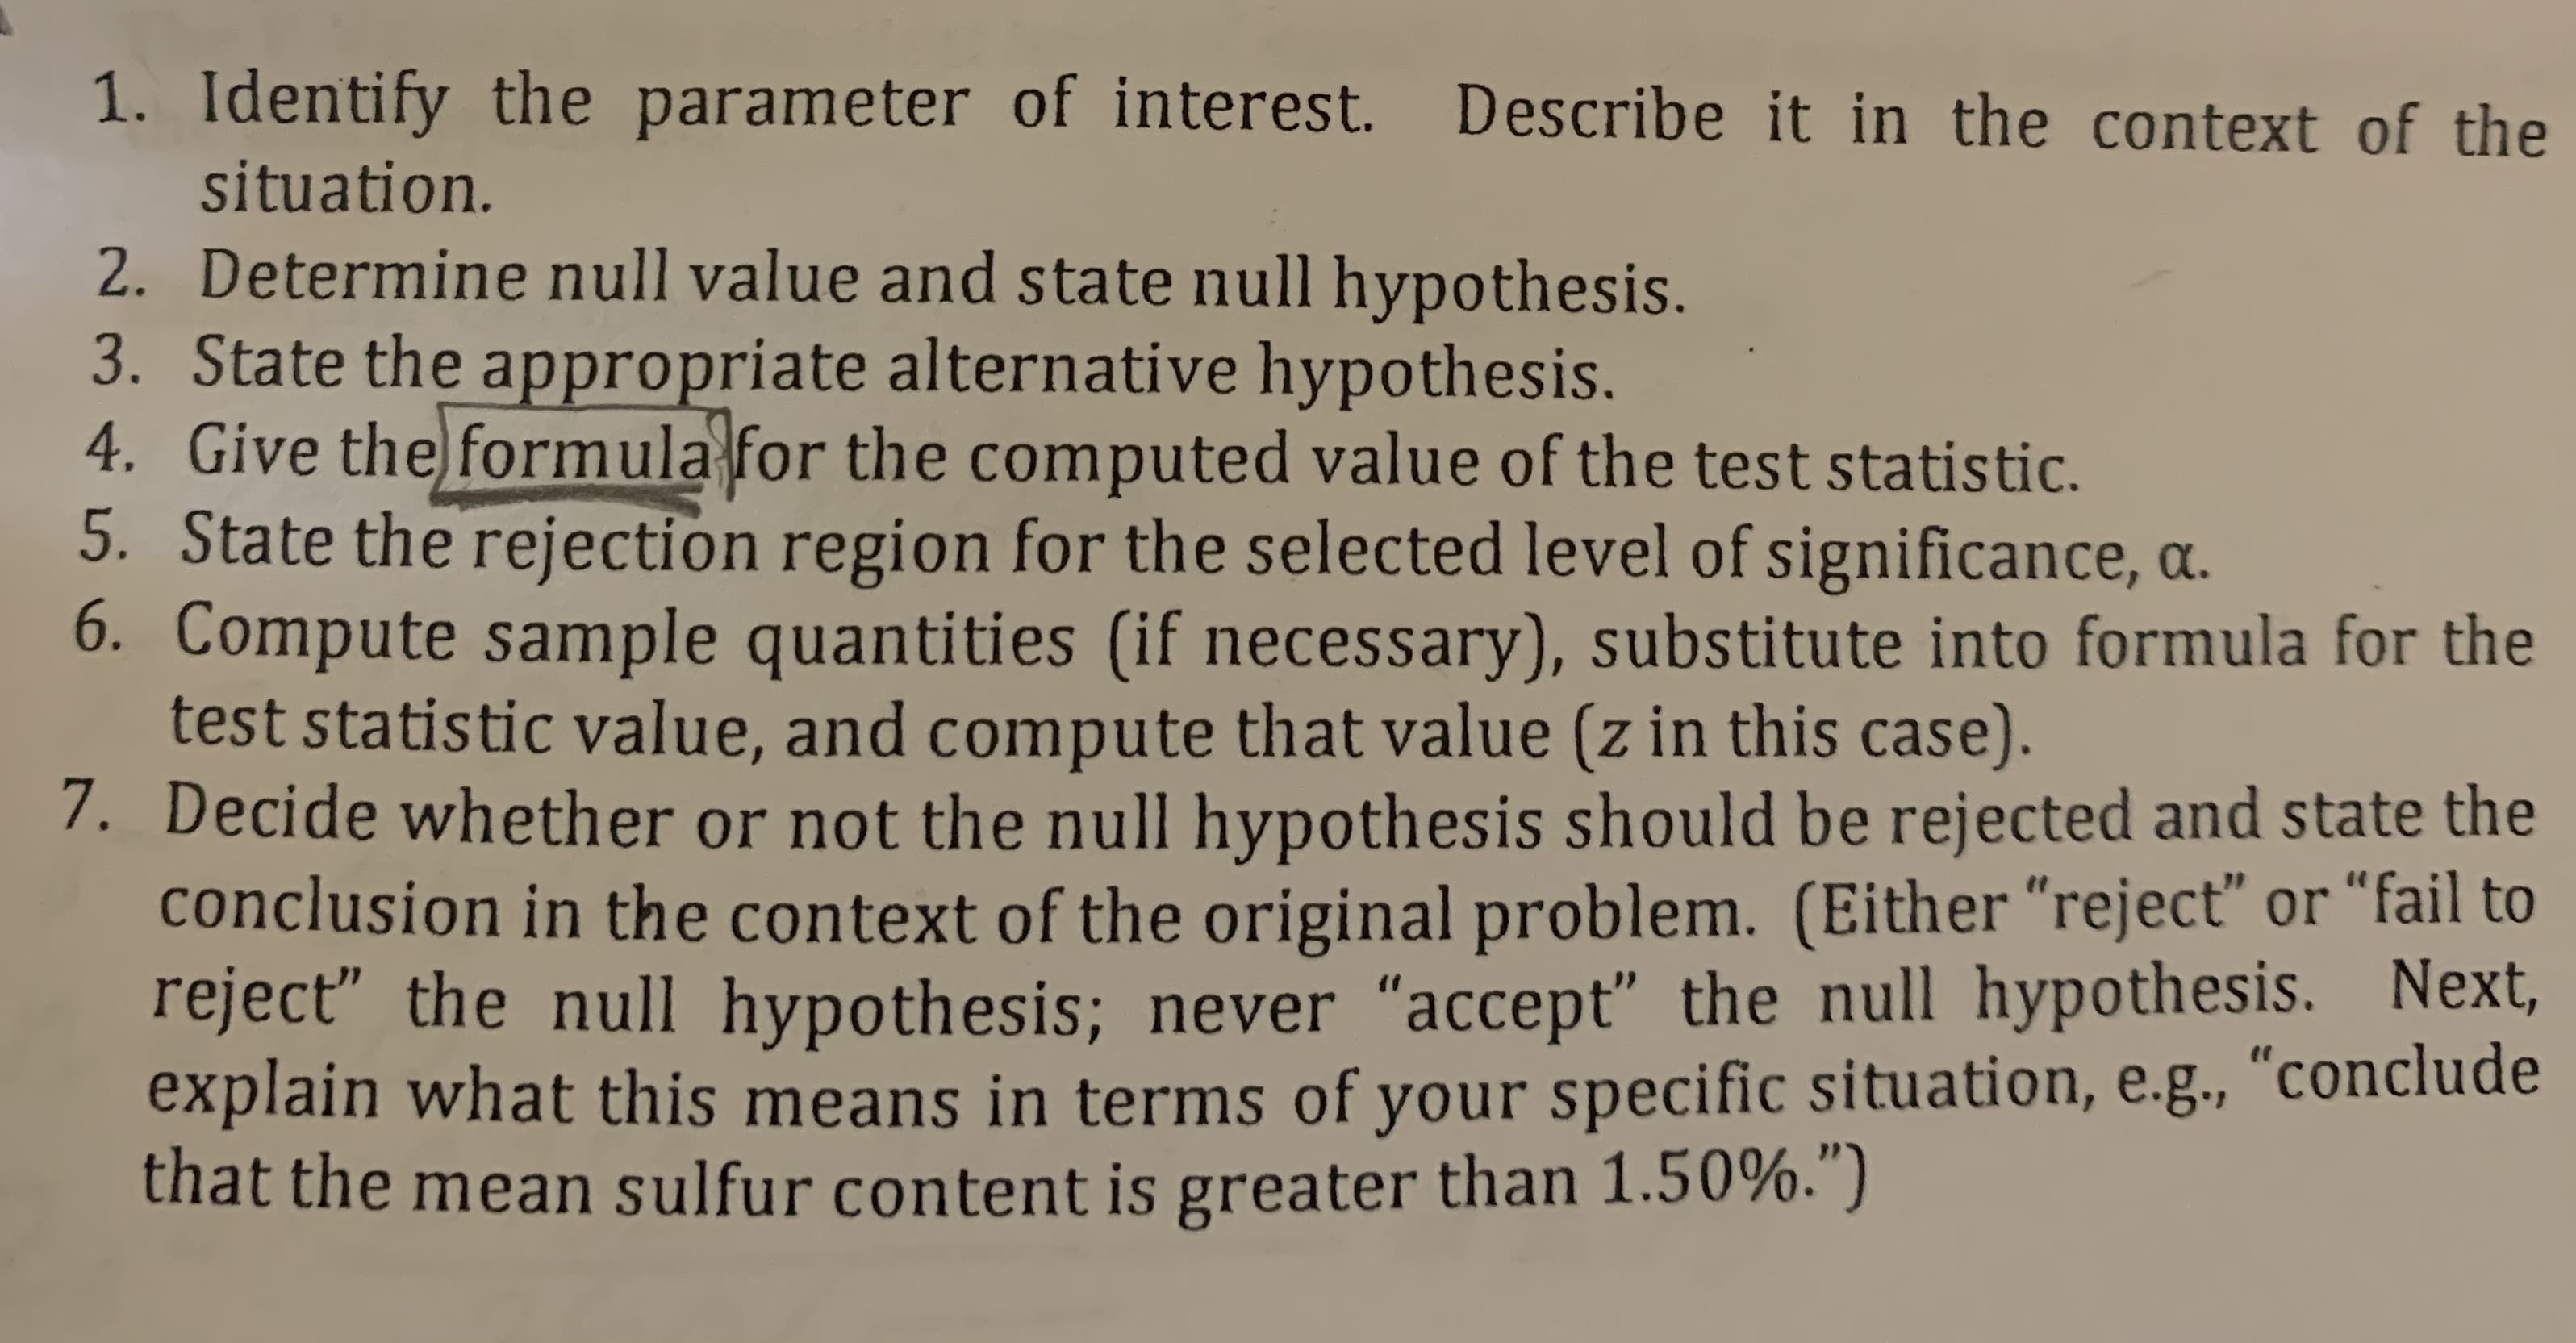
Transcribed Image Text:1. Identify the parameter of interest. Describe it in the context of the
situation.
2. Determine null value and state null hypothesis.
3. State the appropriate alternative hypothesis.
4. Give the formula for the computed value of the test statistic.
5. State the rejection region for the selected level of significance, a.
6. Compute sample quantities (if necessary), substitute into formula for the
test statistic value, and compute that value (z in this case).
7. Decide whether or not the null hypothesis should be rejected and state the
conclusion in the context of the original problem. (Either "reject" or "fail to
reject the null hypothesis; never "accept" the null hypothesis. Next,
explain what this means in terms of your specific situation, e.g., "conclude
that the mean sulfur content is greater than 1.50%.")
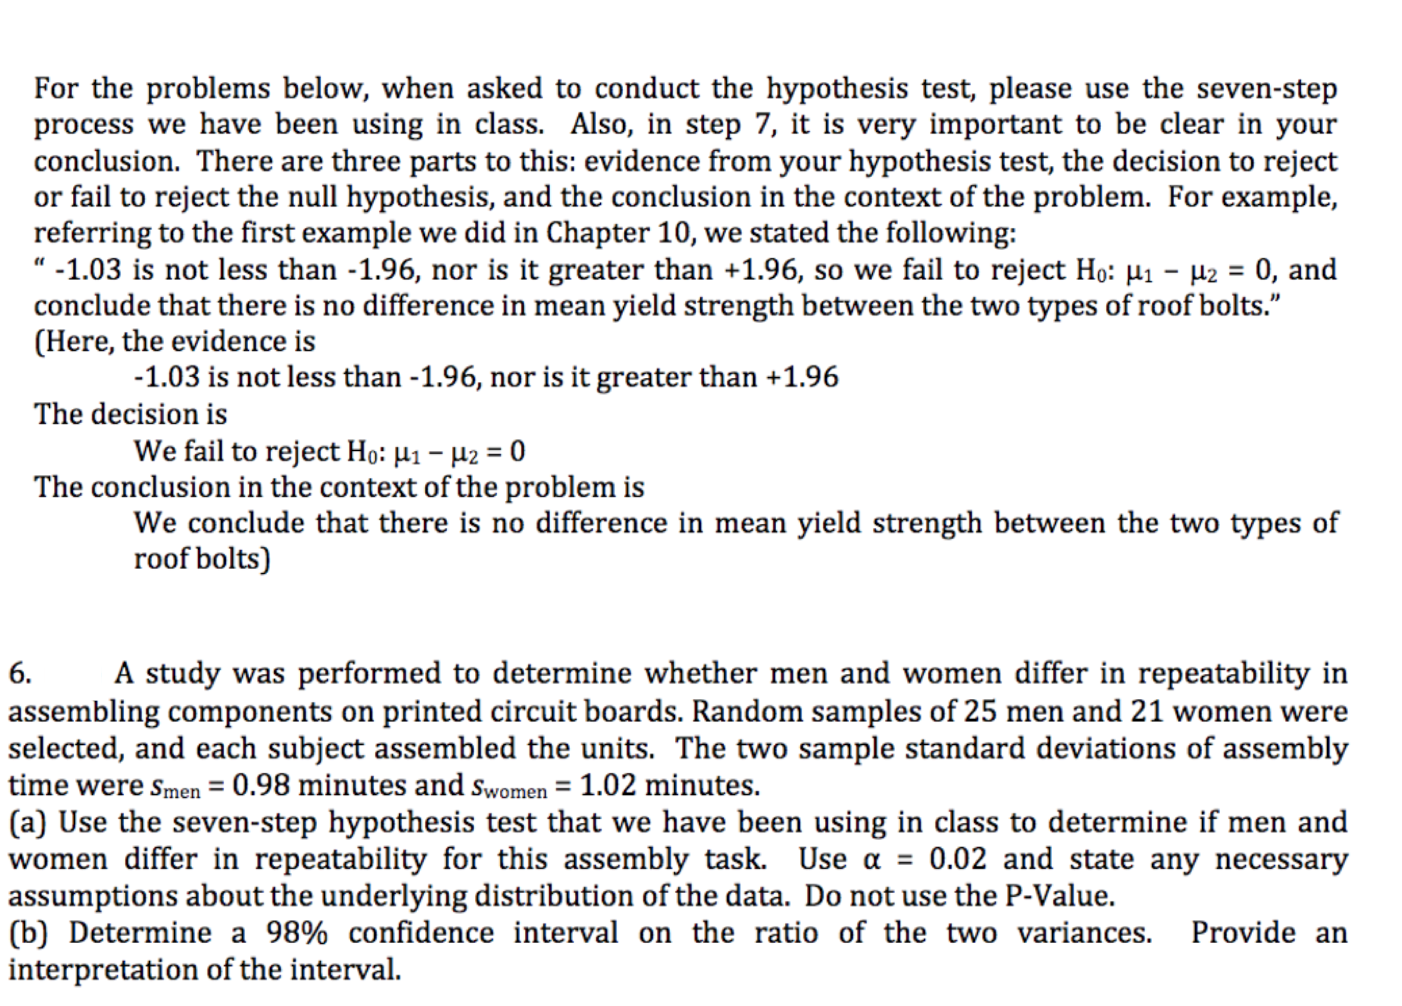
Transcribed Image Text:For the problems below, when asked to conduct the hypothesis test, please use the seven-step
process we have been using in class. Also, in step 7, it is very important to be clear in your
conclusion. There are three parts to this: evidence from your hypothesis test, the decision to reject
or fail to reject the null hypothesis, and the conclusion in the context of the problem. For example,
referring to the first example we did in Chapter 10, we stated the following
"-1.03 is not less than -1.96, nor is it greater than +1.96, so we fail to reject Ho: Hi - 2 0, and
conclude that there is no difference in mean yield strength between the two types of roof bolts."
(Here, the evidence is
-1.03 is not less than -1.96, nor is it greater than +1.96
The decision is
We fail to reject Ho: H1-2 = 0
The conclusion in the context of the problem is
We conclude that there is no difference in mean yield strength between the two types of
roof bolts)
A study was performed to determine whether men and women differ in repeatability in
6.
assembling components on printed circuit boards. Random samples of 25 men and 21 women were
selected, and each subject assembled the units. The two sample standard deviations of assembly
time were smen = 0.98 minutes and swomen 1.02 minutes.
(a) Use the seven-step hypothesis test that we have been using in class to determine if men and
women differ in repeatability for this assembly task. Use a = 0.02 and state any necessary
assumptions about the underlying distribution of the data. Do not use the P-Value.
(b) Determine a 98% confidence interval on the ratio of the two variances.
interpretation of the interval
Provide an
Expert Solution
This question has been solved!
Explore an expertly crafted, step-by-step solution for a thorough understanding of key concepts.

This is a popular solution!

Trending now
This is a popular solution!

Step by step
Solved in 4 steps with 3 images

Knowledge Booster


Learn more about
Need a deep-dive on the concept behind this application? Look no further. Learn more about this topic, statistics and related others by exploring similar questions and additional content below.Recommended textbooks for you
MATLAB: An Introduction with Applications
Statistics
ISBN:
9781119256830
Author:
Amos Gilat
Publisher:
John Wiley & Sons Inc

Probability and Statistics for Engineering and th…
Statistics
ISBN:
9781305251809
Author:
Jay L. Devore
Publisher:
Cengage Learning

Statistics for The Behavioral Sciences (MindTap C…
Statistics
ISBN:
9781305504912
Author:
Frederick J Gravetter, Larry B. Wallnau
Publisher:
Cengage Learning
MATLAB: An Introduction with Applications
Statistics
ISBN:
9781119256830
Author:
Amos Gilat
Publisher:
John Wiley & Sons Inc
Probability and Statistics for Engineering and th…
Statistics
ISBN:
9781305251809
Author:
Jay L. Devore
Publisher:
Cengage Learning
Statistics for The Behavioral Sciences (MindTap C…
Statistics
ISBN:
9781305504912
Author:
Frederick J Gravetter, Larry B. Wallnau
Publisher:
Cengage Learning

Elementary Statistics: Picturing the World (7th E…
Statistics
ISBN:
9780134683416
Author:
Ron Larson, Betsy Farber
Publisher:
PEARSON

The Basic Practice of Statistics
Statistics
ISBN:
9781319042578
Author:
David S. Moore, William I. Notz, Michael A. Fligner
Publisher:
W. H. Freeman

Introduction to the Practice of Statistics
Statistics
ISBN:
9781319013387
Author:
David S. Moore, George P. McCabe, Bruce A. Craig
Publisher:
W. H. Freeman