3. Consider the following competing hypotheses: (You may find it useful to reference the appropriate table: z table or ttable) Hypotheses: Ho: HD s 6; HA: HD > 6 Sample results: X 01:05:54 d = 8.2, sp = 7.2, n = 11 The following results are obtained using matched samples from two normally distributed populations: a. Calculate the value of the test statistic, assuming that the sample difference is normally distributed. (Negative value should be indicated by a minus sign. Round final answer to 3 decimal places.) Test statistic b. Find the p-value. O pvalue Picture 0.10 0.05 Picture p-value < 0.10 O 0.025 Picture p-value < 0.05 0.01 Picture p-value < 0.025 O p-value < 0.01
3. Consider the following competing hypotheses: (You may find it useful to reference the appropriate table: z table or ttable) Hypotheses: Ho: HD s 6; HA: HD > 6 Sample results: X 01:05:54 d = 8.2, sp = 7.2, n = 11 The following results are obtained using matched samples from two normally distributed populations: a. Calculate the value of the test statistic, assuming that the sample difference is normally distributed. (Negative value should be indicated by a minus sign. Round final answer to 3 decimal places.) Test statistic b. Find the p-value. O pvalue Picture 0.10 0.05 Picture p-value < 0.10 O 0.025 Picture p-value < 0.05 0.01 Picture p-value < 0.025 O p-value < 0.01

MATLAB: An Introduction with Applications
6th Edition
ISBN:9781119256830
Author:Amos Gilat
Publisher:Amos Gilat
Chapter1: Starting With Matlab
Section: Chapter Questions
Problem 1P

Related questions
Question
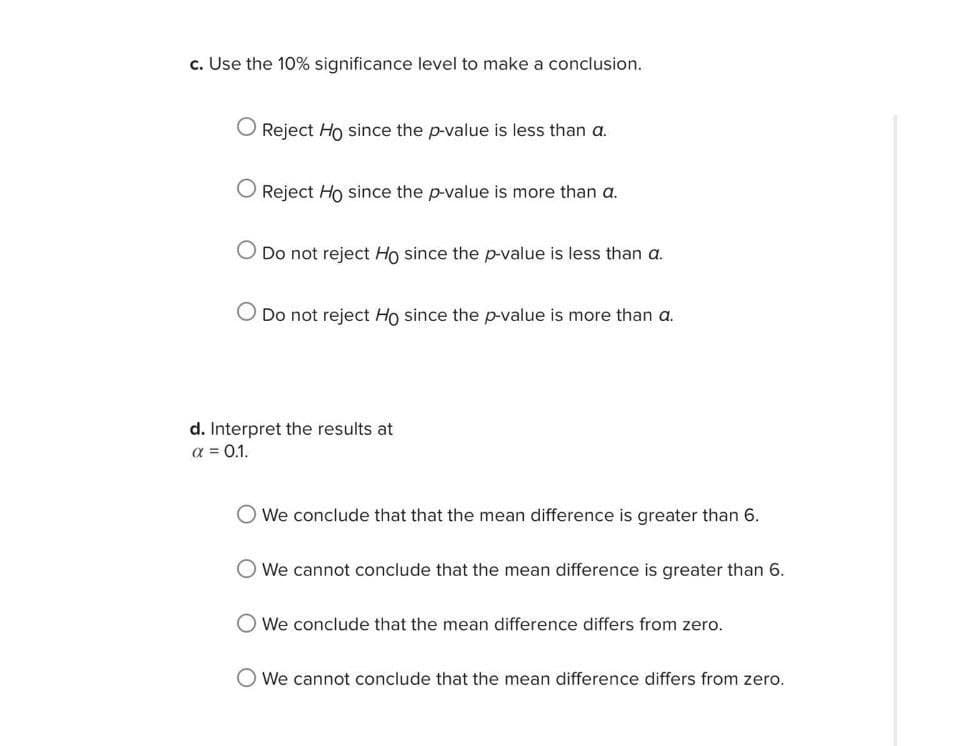
Transcribed Image Text:c. Use the 10% significance level to make a conclusion.
Reject Ho since the p-value is less than a.
Reject Ho since the p-value is more than a.
O Do not reject Ho since the p-value is less than a.
Do not reject Ho since the p-value is more than a.
d. Interpret the results at
a = 0.1.
O We conclude that that the mean difference is greater than 6.
We cannot conclude that the mean difference is greater than 6.
We conclude that the mean difference differs from zero.
We cannot conclude that the mean difference differs from zero.
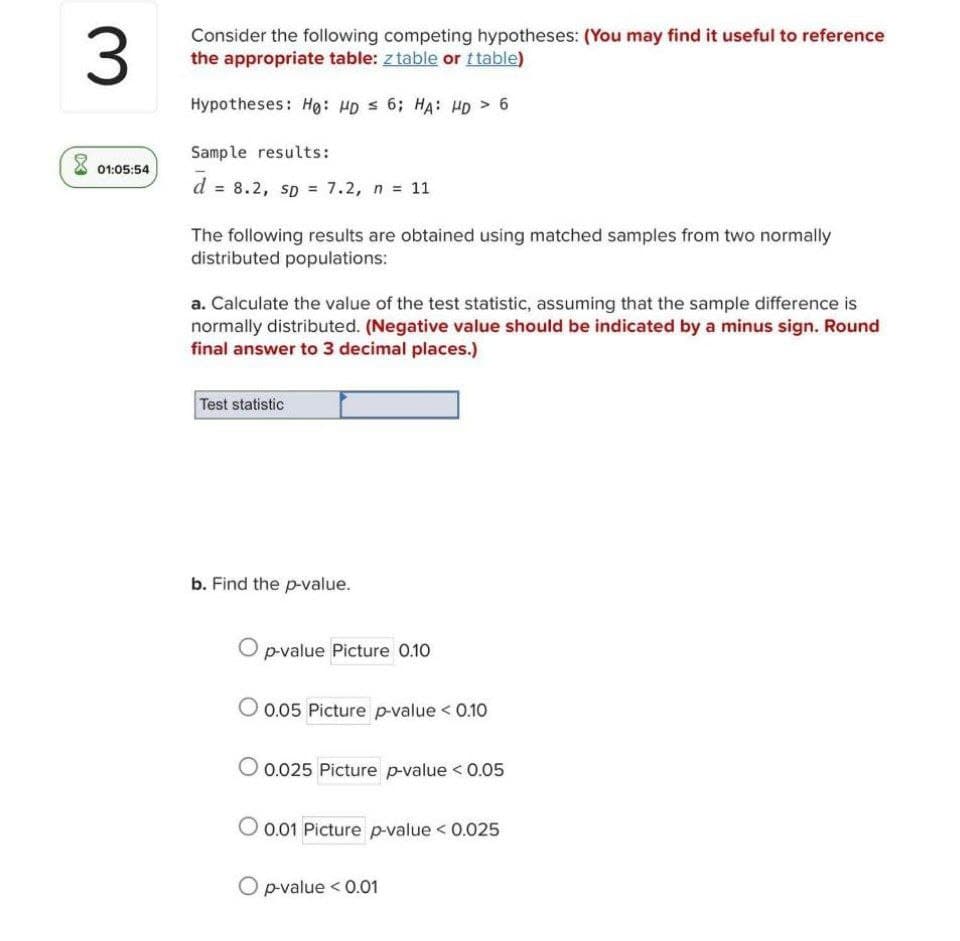
Transcribed Image Text:3.
Consider the following competing hypotheses: (You may find it useful to reference
the appropriate table: z table or ttable)
Hypotheses: Hg: HD s 6; HA: HD > 6
Sample results:
01:05:54
d = 8.2, sp = 7.2, n = 11
The following results are obtained using matched samples from two normally
distributed populations:
a. Calculate the value of the test statistic, assuming that the sample difference is
normally distributed. (Negative value should be indicated by a minus sign. Round
final answer to 3 decimal places.)
Test statistic
b. Find the p-value.
O pvalue Picture 0.10
0.05 Picture p-value < 0.10
O 0.025 Picture p-value < 0.05
0.01 Picture p-value < 0.025
O p-value < 0.01
Expert Solution
This question has been solved!
Explore an expertly crafted, step-by-step solution for a thorough understanding of key concepts.

Step by step
Solved in 2 steps with 2 images

Recommended textbooks for you
MATLAB: An Introduction with Applications
Statistics
ISBN:
9781119256830
Author:
Amos Gilat
Publisher:
John Wiley & Sons Inc

Probability and Statistics for Engineering and th…
Statistics
ISBN:
9781305251809
Author:
Jay L. Devore
Publisher:
Cengage Learning

Statistics for The Behavioral Sciences (MindTap C…
Statistics
ISBN:
9781305504912
Author:
Frederick J Gravetter, Larry B. Wallnau
Publisher:
Cengage Learning
MATLAB: An Introduction with Applications
Statistics
ISBN:
9781119256830
Author:
Amos Gilat
Publisher:
John Wiley & Sons Inc
Probability and Statistics for Engineering and th…
Statistics
ISBN:
9781305251809
Author:
Jay L. Devore
Publisher:
Cengage Learning
Statistics for The Behavioral Sciences (MindTap C…
Statistics
ISBN:
9781305504912
Author:
Frederick J Gravetter, Larry B. Wallnau
Publisher:
Cengage Learning

Elementary Statistics: Picturing the World (7th E…
Statistics
ISBN:
9780134683416
Author:
Ron Larson, Betsy Farber
Publisher:
PEARSON

The Basic Practice of Statistics
Statistics
ISBN:
9781319042578
Author:
David S. Moore, William I. Notz, Michael A. Fligner
Publisher:
W. H. Freeman

Introduction to the Practice of Statistics
Statistics
ISBN:
9781319013387
Author:
David S. Moore, George P. McCabe, Bruce A. Craig
Publisher:
W. H. Freeman