1. In a mountainous tourist destination, a lady sells slippers. Her assistant recorded monthly sales. She then checked the record in the Tourist Community Center, which the record shows on the table below: Year 1 Month Sep Oct Nov Dec 351 348 412 501 Jan Feb Mar Apr May Jun Jul Aug Sales | 525 436 458 485 467 402 388 364 (pairs of slippers) No. of 1253 957 1116 1320 1101 963 812 798 764 745 812 1201 tourists Year 2 Month lon Fob Mar Apr Mav Jul Aug Son Oct Nou Dog lun
1. In a mountainous tourist destination, a lady sells slippers. Her assistant recorded monthly sales. She then checked the record in the Tourist Community Center, which the record shows on the table below: Year 1 Month Sep Oct Nov Dec 351 348 412 501 Jan Feb Mar Apr May Jun Jul Aug Sales | 525 436 458 485 467 402 388 364 (pairs of slippers) No. of 1253 957 1116 1320 1101 963 812 798 764 745 812 1201 tourists Year 2 Month lon Fob Mar Apr Mav Jul Aug Son Oct Nou Dog lun

Algebra & Trigonometry with Analytic Geometry
13th Edition
ISBN:9781133382119
Author:Swokowski
Publisher:Swokowski
Chapter6: The Trigonometric Functions
Section6.2: Trigonometric Functions Of Angles
Problem 79E

Related questions
Question
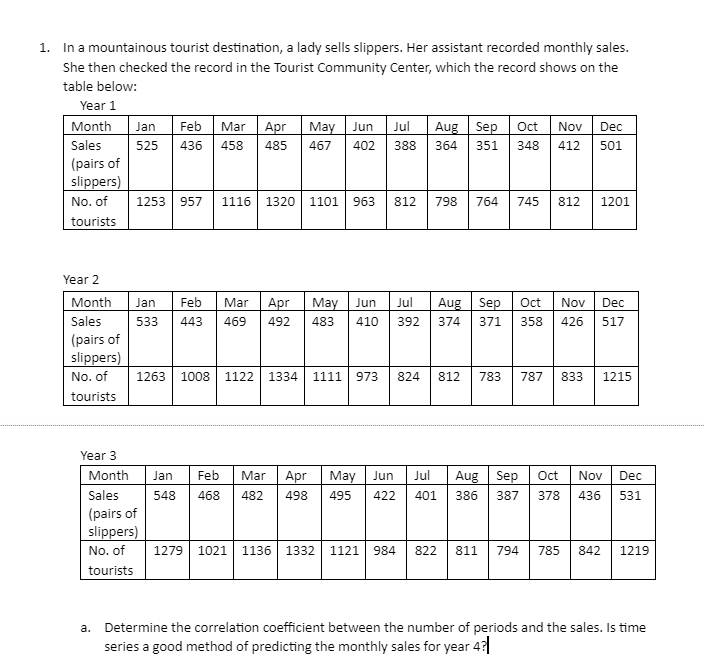
Transcribed Image Text:1. In a mountainous tourist destination, a lady sells slippers. Her assistant recorded monthly sales.
She then checked the record in the Tourist Community Center, which the record shows on the
table below:
Year 1
Jul Aug Sep oct
Nov Dec
348 412 501
Month
Feb
Apr
May Jun
Jan
Mar
Sales
525
436
458
485
467
402
388
364
351
(pairs of
slippers)
No. of
1253 957
1116 1320 1101 963 812
798
764
745
812
1201
tourists
Year 2
Month
Jan
Feb
Mar
Apr
Jul
Aug Sep
Oct
Nov
Dec
May
483
Jun
Sales
533
443
469
492
410
392
374
371
358 426 517
(pairs of
slippers)
No. of
1263 1008 1122 1334 1111 973
824
812
783
787 833
1215
tourists
Year 3
Month
Jan
Feb
Mar
Apr
May
Jun
Jul
Aug Sep
Oct
Nov
Dec
Sales
(pairs of
slippers)
548
468
482
498
495
422
401
386
387
378
436
531
No. of
1279 1021 1136 1332 | 1121 984
822
811
794
785
842
1219
tourists
a. Determine the correlation coefficient between the number of periods and the sales. Is time
series a good method of predicting the monthly sales for year 4?|
Expert Solution
This question has been solved!
Explore an expertly crafted, step-by-step solution for a thorough understanding of key concepts.

Step by step
Solved in 3 steps

Recommended textbooks for you
Algebra & Trigonometry with Analytic Geometry
Algebra
ISBN:
9781133382119
Author:
Swokowski
Publisher:
Cengage
Algebra & Trigonometry with Analytic Geometry
Algebra
ISBN:
9781133382119
Author:
Swokowski
Publisher:
Cengage