Aģe A company held a blood pressure screening clinic for its employees. The results are summarized in the table below by age group and blood pressure level. Under 30 26 48 21 30 - 49 36 90 54 Over 50 32 94 72 Low Normal High TIIII Blood Pressure Under 30 30 - 49 Over 50 Total % Low 26 36 32 94 20 Normal High Total (Round to one decimal place as needed.) 49 31 48 90 94 232 21 54 72 147 95 180 198 473 100.0 b) Find the conditional distribution of blood pressure level within each age group. Start by finding the conditional distribution of blood pressure for the under 30 age group. Blood Pressure Age Low Normal High Total 48 21 26 Under 30 95 27.37 % 50.52 %|23 % 100%
Aģe A company held a blood pressure screening clinic for its employees. The results are summarized in the table below by age group and blood pressure level. Under 30 26 48 21 30 - 49 36 90 54 Over 50 32 94 72 Low Normal High TIIII Blood Pressure Under 30 30 - 49 Over 50 Total % Low 26 36 32 94 20 Normal High Total (Round to one decimal place as needed.) 49 31 48 90 94 232 21 54 72 147 95 180 198 473 100.0 b) Find the conditional distribution of blood pressure level within each age group. Start by finding the conditional distribution of blood pressure for the under 30 age group. Blood Pressure Age Low Normal High Total 48 21 26 Under 30 95 27.37 % 50.52 %|23 % 100%

Glencoe Algebra 1, Student Edition, 9780079039897, 0079039898, 2018
18th Edition
ISBN:9780079039897
Author:Carter
Publisher:Carter
Chapter4: Equations Of Linear Functions
Section: Chapter Questions
Problem 8SGR

Related questions
Question
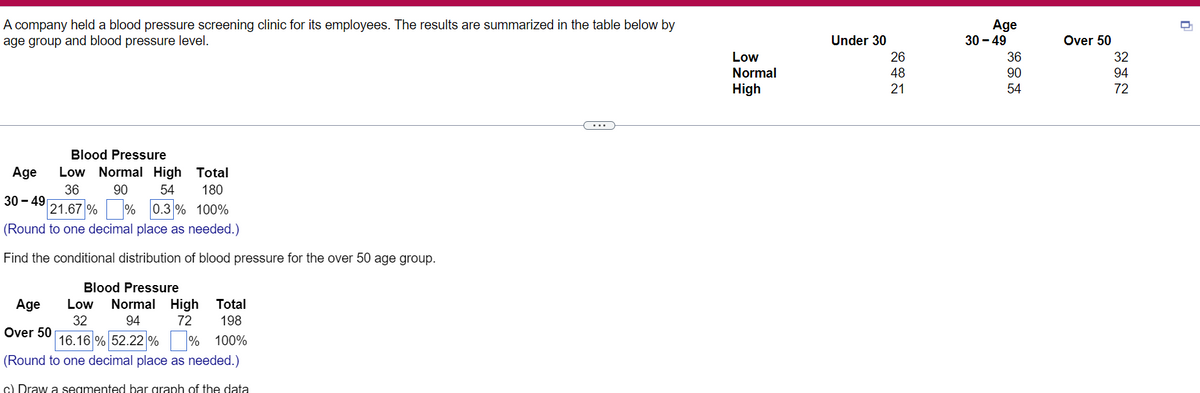
Transcribed Image Text:A company held a blood pressure screening clinic for its employees. The results are summarized in the table below by
age group and blood pressure level.
Age
30 - 49
Under 30
Over 50
Low
26
36
32
Normal
48
90
94
High
21
54
72
...
Blood Pressure
Age
Low Normal High Total
36
90
54
180
30 - 49
21.67 % % 0.3 % 100%
(Round to one decimal place as needed.)
Find the conditional distribution of blood pressure for the over 50 age group.
Blood Pressure
Age
Low Normal High Total
32
94
72
198
Over 50
16.16 % 52.22 % % 100%
(Round to one decimal place as needed.)
c) Draw a seamented bar graph of the data
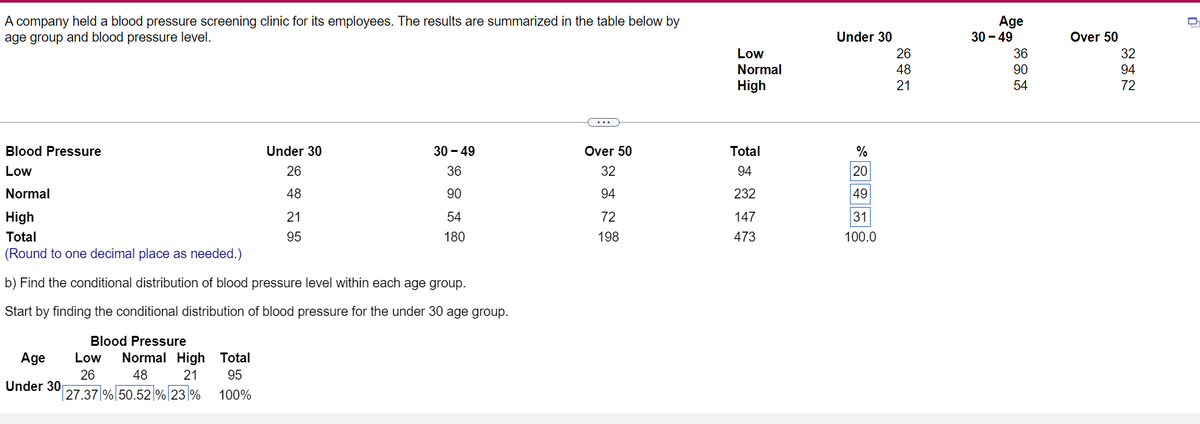
Transcribed Image Text:A company held a blood pressure screening clinic for its employees. The results are summarized in the table below by
age group and blood pressure level.
Age
30 - 49
Under 30
Over 50
Low
Normal
26
36
32
48
90
94
High
21
54
72
Blood Pressure
Under 30
30 - 49
Over 50
Total
%
Low
26
36
32
94
20
Normal
48
90
94
232
49
High
21
54
72
147
31
Total
95
180
198
473
100.0
(Round to one decimal place as needed.)
b) Find the conditional distribution of blood pressure level within each age group.
Start by finding the conditional distribution of blood pressure for the under 30 age group.
Blood Pressure
Age
Low
Normal High Total
26
Under 30
48
21
95
|27.37|%|50.52|%|23|%
100%
Expert Solution
This question has been solved!
Explore an expertly crafted, step-by-step solution for a thorough understanding of key concepts.

This is a popular solution!

Trending now
This is a popular solution!

Step by step
Solved in 2 steps with 1 images

Recommended textbooks for you
Glencoe Algebra 1, Student Edition, 9780079039897…
Algebra
ISBN:
9780079039897
Author:
Carter
Publisher:
McGraw Hill

College Algebra (MindTap Course List)
Algebra
ISBN:
9781305652231
Author:
R. David Gustafson, Jeff Hughes
Publisher:
Cengage Learning
Glencoe Algebra 1, Student Edition, 9780079039897…
Algebra
ISBN:
9780079039897
Author:
Carter
Publisher:
McGraw Hill
College Algebra (MindTap Course List)
Algebra
ISBN:
9781305652231
Author:
R. David Gustafson, Jeff Hughes
Publisher:
Cengage Learning