1. In the table below indicate for each column the measurement level Month of Temperature Weight in the UK Time of the Number of IQ day Car Test Brand the year of gold broken Scores cups 7 Ford January February March 4°C 8°C 3°C 32°C 40g 1kg 30g 100g ? 09:00 80 GM 12:00 8 120 Tesla 15:00 14 160 Volvo April 22:00 140 ?
1. In the table below indicate for each column the measurement level Month of Temperature Weight in the UK Time of the Number of IQ day Car Test Brand the year of gold broken Scores cups 7 Ford January February March 4°C 8°C 3°C 32°C 40g 1kg 30g 100g ? 09:00 80 GM 12:00 8 120 Tesla 15:00 14 160 Volvo April 22:00 140 ?

MATLAB: An Introduction with Applications
6th Edition
ISBN:9781119256830
Author:Amos Gilat
Publisher:Amos Gilat
Chapter1: Starting With Matlab
Section: Chapter Questions
Problem 1P

Related questions
Question
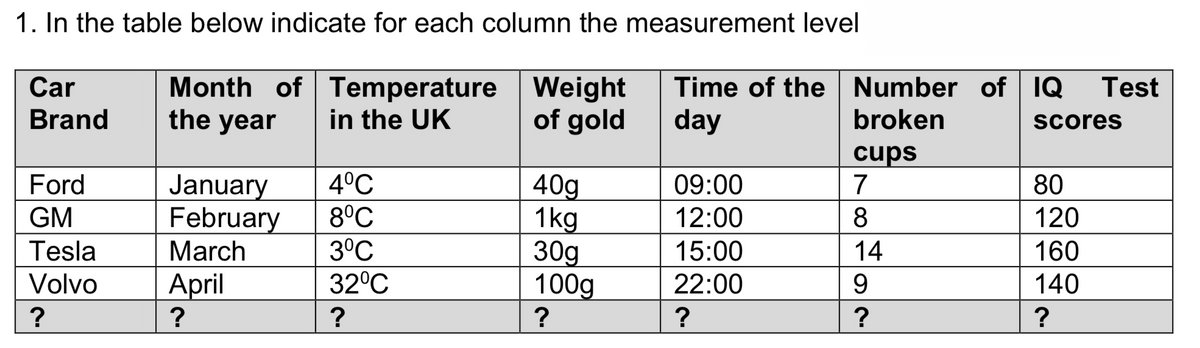
Transcribed Image Text:1. In the table below indicate for each column the measurement level
Month of Temperature Weight
in the UK
Time of the Number of IQ
day
Car
Test
Brand
the year
of gold
broken
Scores
cups
7
4°C
8°C
3°C
32°C
Ford
80
January
February
March
40g
1kg
30g
100g
09:00
GM
12:00
8
120
Tesla
15:00
14
160
Volvo
April
22:00
9.
140
?
Expert Solution
This question has been solved!
Explore an expertly crafted, step-by-step solution for a thorough understanding of key concepts.

Step by step
Solved in 3 steps

Recommended textbooks for you
MATLAB: An Introduction with Applications
Statistics
ISBN:
9781119256830
Author:
Amos Gilat
Publisher:
John Wiley & Sons Inc

Probability and Statistics for Engineering and th…
Statistics
ISBN:
9781305251809
Author:
Jay L. Devore
Publisher:
Cengage Learning

Statistics for The Behavioral Sciences (MindTap C…
Statistics
ISBN:
9781305504912
Author:
Frederick J Gravetter, Larry B. Wallnau
Publisher:
Cengage Learning
MATLAB: An Introduction with Applications
Statistics
ISBN:
9781119256830
Author:
Amos Gilat
Publisher:
John Wiley & Sons Inc
Probability and Statistics for Engineering and th…
Statistics
ISBN:
9781305251809
Author:
Jay L. Devore
Publisher:
Cengage Learning
Statistics for The Behavioral Sciences (MindTap C…
Statistics
ISBN:
9781305504912
Author:
Frederick J Gravetter, Larry B. Wallnau
Publisher:
Cengage Learning

Elementary Statistics: Picturing the World (7th E…
Statistics
ISBN:
9780134683416
Author:
Ron Larson, Betsy Farber
Publisher:
PEARSON

The Basic Practice of Statistics
Statistics
ISBN:
9781319042578
Author:
David S. Moore, William I. Notz, Michael A. Fligner
Publisher:
W. H. Freeman

Introduction to the Practice of Statistics
Statistics
ISBN:
9781319013387
Author:
David S. Moore, George P. McCabe, Bruce A. Craig
Publisher:
W. H. Freeman