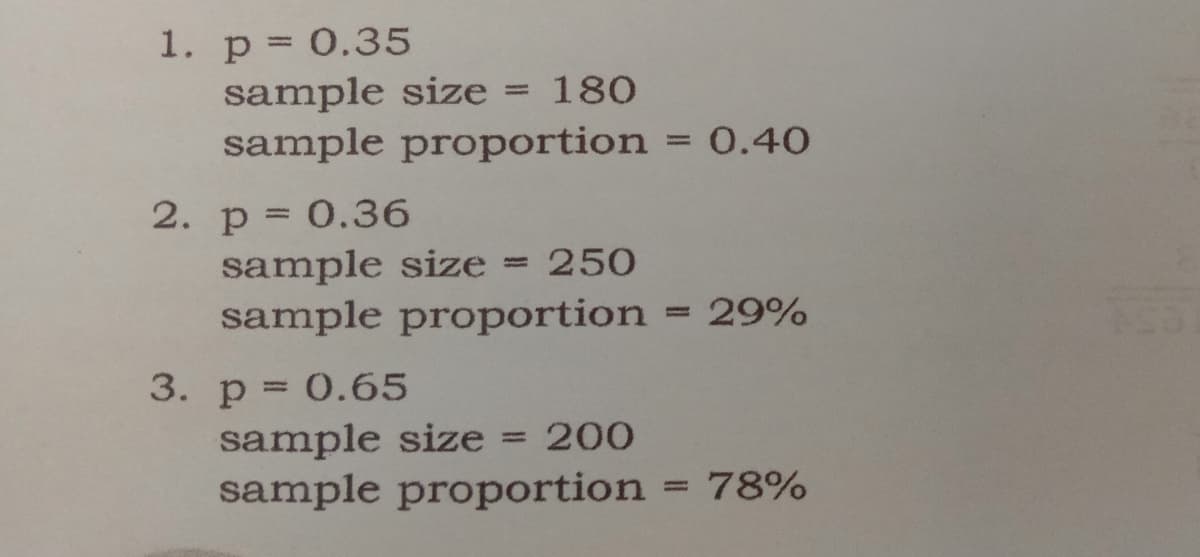
1. p = 0.35 sample size = 180 sample proportion = 0.40 %3D 2. p = 0.36 sample size = 250 sample proportion 29% %3D 3. p = 0.65 sample size = 200 sample proportion 78%


Q: Shoppers were asked about their regular grocery shopping locations. The table below shows the…
A: The image is attached below,
Q: You are trying to estimate the percent of people in California who have a college degree. You…
A: According to the given information in this question We need to identify that from the given…
Q: Male players at the high school, college, and professional ranks use regulation basketballs that…
A: Let X be the random variable from normal distribution with mean (μ) = 22.0 and standard deviation…
Q: What is the proper way to interpret a 95% confidence level (or the confidence interval procedure)? O…
A: what is the proper way to interpret a 95% confidence level ( or the confidence interval procedure…
Q: Find both the x-intercept and the y-intercept of the line given by this equation. 1.3x+2.4y-2.2 = 0…
A:
Q: English Air continually monitors the proportion of overweight items checked by passengers on its…
A: The provided information is a. n1=226, n2=300x1=30, x2=54α=0.01The null and alternative hypothesis…
Q: 1. A community-based intervention program for hypertension was undertaken in two communities to…
A: Prevalance is the special measure in the epideomology of case control study. It used to estimate the…
Q: 1) Please answer the questions and show your work FOR BOTH PARTS in the space provided. The…
A: Regression Analysis: A researcher uses a regression model to determine the association between the…
Q: 35. A line segment AB is divided into three parts by two points P1 and P2 at random. Find the…
A:
Q: In the twentieth century, it was a common practice in Southern California for houses to be built…
A: Solution: Given information: n1= 138n2= 84x1=…
Q: The data in the table below pertains to employees of a large oil refining firm in Durban. Age…
A: Given Total number of employees 200
Q: Using the latest in medical technology, an orthopedic doctor has developed a new surgical procedure…
A: We have to test whether the population mean of the recovery times of patients who have the new…
Q: In the twentieth century, it was a common practice in Southern California for houses to be built…
A: Hello! As you have posted more than 3 sub parts, we are answering the first 3 sub-parts. In case…
Q: I will be giving away 4 vanilla cupcakes and 5 strawberry cupcakes to my cousins. If I will give 2…
A: As per bartleby guidelines we can solve only first question and rest can be reposted
Q: The following data table is organized using which method? Gender Age Male 35 Female 42 Female 33…
A:
Q: An adventure company runs two obstacle courses, Fundash and Coolsprint. The designer of the courses…
A: There are two independent samples which are Fun dash runners and Cool sprint runners. We have to…
Q: Here are summary statistics for randomly selected weights of newborn girls: n = 236, x= 30.3 hg, s=…
A: Given Data : n = 236 x̄ = 30.3 s = 6.1 α =1- 0.9 = 0.1
Q: In a study of the accuracy of fast food drive-through orders, one restaurant had 31 orders that were…
A: Claim : The rate of inaccurate orders is equal to 10%
Q: 3. The thickness of a road is normally distributed with standard deviation 5.8 cm. A random sample…
A: Given taht n =15,s.d =5.8, x bar =10.2
Q: P(x) 0.15 4 0.35 0.40 18 0.10 P(x) 0.10 4 0.40 0.35 0.15
A: 1. The provided information is x p(x) x*P(x) x2p(x) 3 0.15 0.45 1.35 6 0.35 2.1 12.6 8 0.40…
Q: probability that the cards are not all face cards.
A: A standard deck of cards contains 52 cards with a total of 12 face cards, 3 from each suit. Three…
Q: What is the expected value of a ticket?
A: here given, Supposed that 2000 tickets are sold for a raffle that has the following prizes: one $200…
Q: Problem 9.11 relates to Work Cells After an extensive product analysis using group tech- •• 9.11…
A:
Q: Shoppers were asked about their regular grocery shopping locations. The table below shows the…
A:
Q: 2. You are conducting an experiment that involves a coin and a standard 6-sided die. First, you roll…
A:
Q: a. The fact that cars have different weights explains about 40% of the observed variation in their…
A: We have given that, Correlation coefficient (r) = -0.4 and coefficient of determination (r2 ) = 0.16…
Q: Which of the following correlation coefficients indicates the strongest linear relationship? O a.…
A: We have given that, Which of the following correlation coefficient indicates the strongest linear…
Q: Expenditure on Food when that on Accommodation is Known. To study the relationship between…
A: Given that, to study the relationship between Expenditure on Accommodation, $x and Expenditure on…
Q: Group of answer choices A.50, 51, 52, 53, 54, 55, 56
A: As we have given 3 data samples. A B C 50 50 51 51 51 52 52 52 53 53 53 54 54 54 55…
Q: The university data center has two main computers: computer 1 and computer 2. A new routine has…
A: There are two independent samples which are computer 1 and computer 2. We have to test whether the…
Q: Norman is performing a hypothesis test in which he rejects the null hypothesis at a significance…
A: Given that Norman is performing a hypothesis test in which he rejects the null hypothesis H0. Level…
Q: The shape of the distribution of the house prices shown in this histogram is! Distribution of House…
A: The relative frequency histogram of house prices is given.
Q: Distribution of Speeds (mph) for 50 Cars 45 47 49 51 53 55 57 59 61 63 65 67 69 Speed (mph) What…
A: Given Total number of cars =50
Q: Complete the following contingency table based on column percentages. Outcome Not successful…
A: Contingency table explains the similarity and dissimilarity between the categorical variable has…
Q: Collect data from 15 of your classmates as shown below and answer the following problem. Show…
A: To test the hypothesis that the average number of siblings of all students in the respective section…
Q: Find the z-score that corresponds to the given area under the standard normal curve. Round answers…
A:
Q: The boxplots below represent movie runtimes (the length of a movie in minutes) for a random sample…
A: The given boxplots represent movie runtimes for a random sample of 100 movies in each of the four…
Q: Let A and B be two events such that P (A) = 0.78 and P(B) = 0.01. %3D Do not round your responses.…
A: From the provided information, A and B be two events. P (A) = 0.78 and P (B) = 0.01
Q: What is the approximate standard deviation of the final exam scores?
A:
Q: A researcher was studying whether education was the biggest determining factor for earning…
A: The strength and direction of linear relationship between two variables is measured by correlation.
Q: We are interested in determining whether or not illness is independent of smoking. a. State the…
A: Given : Illness Non-Smokers Smokers Totals Emphysema 20 50 70 Heart problem 70…
Q: Consider the dynamic regression model: Yt = 1.5 + 0.5yt-1 + 1.4x¢ + 0.7xt-1 + &¢ At time t*, there…
A:
Q: Fathers and eldest Sons I. Q's. The/table below shows the respective I. Q's of 10 fathers and their…
A: For the given data, we need to find the rank correlation coefficient.
Q: In a spelling contest, the mean mark of the 32 boys was 72 with the standard deviation of 8 while…
A: Given Data : For Sample 1 x̄1 = 72 s1 = 8 n1 = 32 For Sample 2 x̄2 = 75…
Q: Perform a two-tailed test. Then complete the parts below. Carry your intermediate computations to…
A: Use the Two sample independent t test Sample Mean 36.41 Standard Deviation (S1)…
Q: 7) Please answers in the space provided. Arrange the labels for each scatterplot in order from…
A: Arrange the labels for each scatterplot in order from weakest correlation to strongest correlation
Q: In a recent year, the total scores for a certain standardized test were normally distributed, with a…
A: Let X be the random variable from normal distribution with mean (μ) = 500 and standard deviation (σ)…
Q: A new drug is designed to reduce a person's blood pressure. Eight randomly selected hypertensive…
A: Let X be the number of patients see a reduction in blood pressure having probability mass function…
Q: Given the following time series Y;: Y; = 1.5 + Y;-1 +& (a) Examine the stationarity of Y. (b) Apply…
A:
Q: Q.6.2 It has been found that 14% of customers of an online retail store wait longer than five days…
A: From the provided information, It has been found that 14% of customers of an online retail store…


Trending now
This is a popular solution!

Step by step
Solved in 2 steps with 2 images

- A municipal solid-waste site for a city must be located at Site A or Site B. After sorting, some of the solid refuse will be transported to an electric powerplant where it will be used as fuel. Data for the hauling of refuse from each site to the power plant are shown in Table P2-4. If the power plant will pay $8.00 per cubic yard of sorted solid waste delivered to the plant, where should the solid-waste site be located? Use the city’s viewpoint and assume that 200,000 cubic yards of refuse will be hauled to the plant for one year only. One site must be selected.Answer question #9. Show the graph of the rejection region.What size samples do you need for a 2-group design if you expect to have an effect size of .50 and you want your power to be .71?
- 6) part 4. Generate a abo plot for the asteroid data.Samples of emissions from three suppliers are classified for conformance to air-quality specifications. The results from 100 samples are summarized as follows I need a step-by-step solution and an explanation. Thank you!A glass manufacturing company wanted to investigate the effect of breakoff pressure and stopper height on the percentage of breaking off chips. The results are in the accompanying table. Complete parts (a) through (e). a. At the 0.01 level of significance is there an interaction between the breakoff pressure and the stopper height? b. is there an effect due to the breakoff pressure? c. is there an effect due to the stopper height? d. Plot the percentage breakoff for each breakoff pressure for each stopper height. e. Discuss the results of (a) through (d).
- The Prevalence per 10,000 population of having health insurance for 1 (Table 5 box s. above) is: The Prevalence per 10,000 population of having health insurance for 2 (Table 5 box w. above) is:Question 9b . Describe the relationship displayed in the scatterplot (Using DUFS)Construct a hypothesis addressing which potato piece will have the greatest surface-area-to-volume ratio. Explain. Table 1a Why Are Cells Small Length (l) (cm) Width (w) (cm) Height (h) (cm) Size of Cross Section (h x w) (cm) Distance Traveled by IKI from Potato Edge (cm) Area of White Region (l x w) (cm) 2.50 2.50 2.50 6.25 cm 0.20 cm 2.64 cm 2.00 2.00 1.00 2.00cm 0.30 cm 1.87 cm 1.50 1.50 1.50 2.25 cm 0.50 cm 1.50 cm 1.00 1.00 1.00 1.00 cm 0.40 0.60 cm 2.00 0.50 0.50 0.25 cm 0.20 cm 0.15 cm 0.50 0.50 0.50 0.25 cm 0.30 cm 0.10 cm
- Two samples of sizes 60 and 90 have 52 and 48 as the respective A.Ms. and 9 and 12 as the respective S.Ds. Find the A.M and S.D. of the combined sample of size 150.part C D 33000331 UPH-1 St. Lawrence dolomite 618 0.05 2.69 2.74 2.83 48000168 Langer Platteville dolomite 127.8 0.06 2.69 2.75 2.86 52000415 3-21-13z1 Galena dolomite 575 0.04 2.72 2.76 2.83 52000415 3-21-13z1 Platteville dolomite 740 0.05 2.7 2.75 2.85 60000086 VD #1 Silurian dolomite 684 0.03 2.75 2.78 2.83 60000086 VD #1 Galena dolomite 1070 0.05 2.69 2.74 2.84 60000086 VD #1 Platteville dolomite 1142 0.02 2.77 2.79 2.83 13001466 NS-2 Tunnel City sandstone 60.1 0.14 2.41 2.54 2.79 13001466 NS-2 Tunnel City sandstone 60.2 0.28 1.93 2.21 2.67 13001466 NS-2 Tunnel City sandstone 118.3 0.3 1.88 2.18 2.7 33000331 UPH-1 St. Peter sandstone 222 0.22 2.06 2.28 2.65 33000331 UPH-1 Jordan sandstone 531 0.21 2.09 2.3 2.65 33000331 UPH-1 Tunnel City sandstone 644 0.18 2.22 2.4 2.7 33000331 UPH-1 Wonewoc sandstone 735 0.2 2.12 2.32 2.65 33000331 UPH-1 Wonewoc sandstone 840 0.27 1.93 2.2 2.66 33000331 UPH-1 Mt. Simon sandstone 927 0.18 2.31 2.49 2.81…The price (in rands) in June of a 1 kg packet of laundry in KwaDukuza is shownis shown below for each 5 years.Year 2016 2017 2018 2019 2020Price 17.8 29.6 41.1 46.3 46.52.2.1 Find the percentage increase in the price of laundry detergent between eachperiod. (2)2.2.2 Use the 4 percentages in question 2.2.1 above, to calculate the overall geometricmean percentage increase in the price of laundry detergent each year. (3)2.2.3 Interpret the geometric mean calculated in 2.2.2 above.