4. Generate a Boxplot for the asteroid data
Glencoe Algebra 1, Student Edition, 9780079039897, 0079039898, 2018
18th Edition
ISBN:9780079039897
Author:Carter
Publisher:Carter
Chapter4: Equations Of Linear Functions
Section: Chapter Questions
Problem 8SGR
Related questions
Question
6) part 4. Generate a abo plot for the asteroid data.
![6)- For the asteroid data of Problem 3,
1. Calculate the sample mean, range and standard deviation
2. Construct the interval 1) mean ± standard deviation, 2) mean ± 2*standard deviation, 3) mean ± 3*standard deviation. [Hint: Provide the
values]
3. Count the number of observations that fall within mean ± 2*standard deviation and compare results to the empirical rule for capturing 95%
of the data.
4. Generate a Boxplot for the asteroid data](/v2/_next/image?url=https%3A%2F%2Fcontent.bartleby.com%2Fqna-images%2Fquestion%2F7d4fd4d4-77c7-4e93-950b-25099f54e660%2F173628a5-cb5c-4ae9-9ead-852064d4296c%2Fokohogl_processed.jpeg&w=3840&q=75)
Transcribed Image Text:6)- For the asteroid data of Problem 3,
1. Calculate the sample mean, range and standard deviation
2. Construct the interval 1) mean ± standard deviation, 2) mean ± 2*standard deviation, 3) mean ± 3*standard deviation. [Hint: Provide the
values]
3. Count the number of observations that fall within mean ± 2*standard deviation and compare results to the empirical rule for capturing 95%
of the data.
4. Generate a Boxplot for the asteroid data

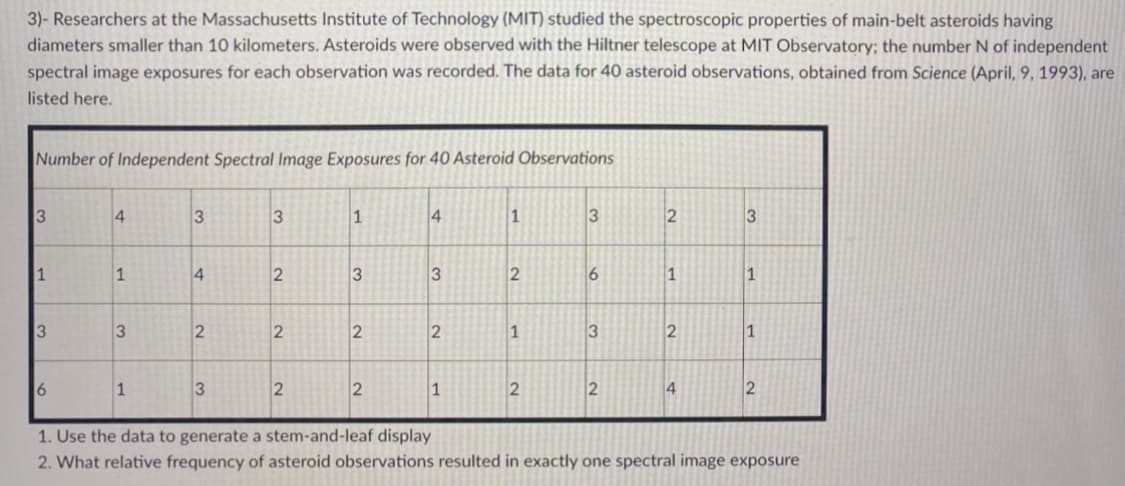
Transcribed Image Text:3)- Researchers at the Massachusetts Institute of Technology (MIT) studied the spectroscopic properties of main-belt asteroids having
diameters smaller than 10 kilometers. Asteroids were observed with the Hiltner telescope at MIT Observatory; the number N of independent
spectral image exposures for each observation was recorded. The data for 40 asteroid observations, obtained from Science (April, 9, 1993), are
listed here.
Number of Independent Spectral Image Exposures for 40 Asteroid Observations
3
4
3
3
1
4
1
3
2
3
1
1
4
2
3
3
2
6
1
1
2
1
3
2
1
1
3
2
2
4
2
1. Use the data to generate a stem-and-leaf display
2. What relative frequency of asteroid observations resulted in exactly one spectral image exposure
2.
Expert Solution
This question has been solved!
Explore an expertly crafted, step-by-step solution for a thorough understanding of key concepts.
This is a popular solution!
Trending now
This is a popular solution!
Step by step
Solved in 5 steps with 3 images

Knowledge Booster
Learn more about
Need a deep-dive on the concept behind this application? Look no further. Learn more about this topic, probability and related others by exploring similar questions and additional content below.Recommended textbooks for you

Glencoe Algebra 1, Student Edition, 9780079039897…
Algebra
ISBN:
9780079039897
Author:
Carter
Publisher:
McGraw Hill

Glencoe Algebra 1, Student Edition, 9780079039897…
Algebra
ISBN:
9780079039897
Author:
Carter
Publisher:
McGraw Hill