1. Prepare comparative income statements showing the percent increase or decrease for the current year in comparison to the prior year. 2. Prepare common-size comparative balance sheets for both years. 3. Compute the following ratios for the current year and identify each one's building block category for financial statement analysis. a. Current ratio g. Debt-to-equity ratio h. Times interest earned i. Profit margin ratio j. Total asset turnover k. Return on total assets I. Return on common stockholders' equity b. Acid-test ratio Accpunts receivable turnover d. Days' sales uncollected e. Inventory turnover c. f. Debt ratio PRECISION COMPANY Comparative Income Statements For Years Ended December 31 Current Yr Prlor Yr Sales ..... $2,486,000 $2,075,000 Cost of goods sold ... Gross profit.... 1,523,000 1,222,000 963,000 853,000 Operating expenses Advertising expense.. Sales salarles expense.. 145,000 100,000 240,000 280,000 Office salarles expense. 165,000 200,000 Insurance expense. 100,000 45,000 Supplles expense.. 26,000 35,000 Depreciation expense 85,000 75,000 Miscellaneous expenses 17,000 15,000 Total operating expenses 778,000 750,000 Operating Income.. 185,000 103,000 Interest expense.. Income before taxes... Income tax expense . Net Income ..... 44,000 46,000 141,000 57,000 47,000 19,000 $ 38,000 $ 94,000 Earnings per share.... 2$ $ 0.99 0.40
1. Prepare comparative income statements showing the percent increase or decrease for the current year in comparison to the prior year. 2. Prepare common-size comparative balance sheets for both years. 3. Compute the following ratios for the current year and identify each one's building block category for financial statement analysis. a. Current ratio g. Debt-to-equity ratio h. Times interest earned i. Profit margin ratio j. Total asset turnover k. Return on total assets I. Return on common stockholders' equity b. Acid-test ratio Accpunts receivable turnover d. Days' sales uncollected e. Inventory turnover c. f. Debt ratio PRECISION COMPANY Comparative Income Statements For Years Ended December 31 Current Yr Prlor Yr Sales ..... $2,486,000 $2,075,000 Cost of goods sold ... Gross profit.... 1,523,000 1,222,000 963,000 853,000 Operating expenses Advertising expense.. Sales salarles expense.. 145,000 100,000 240,000 280,000 Office salarles expense. 165,000 200,000 Insurance expense. 100,000 45,000 Supplles expense.. 26,000 35,000 Depreciation expense 85,000 75,000 Miscellaneous expenses 17,000 15,000 Total operating expenses 778,000 750,000 Operating Income.. 185,000 103,000 Interest expense.. Income before taxes... Income tax expense . Net Income ..... 44,000 46,000 141,000 57,000 47,000 19,000 $ 38,000 $ 94,000 Earnings per share.... 2$ $ 0.99 0.40

Managerial Accounting
15th Edition
ISBN:9781337912020
Author:Carl Warren, Ph.d. Cma William B. Tayler
Publisher:Carl Warren, Ph.d. Cma William B. Tayler
Chapter16: Financial Statement Analysis
Section: Chapter Questions
Problem 4PB

Related questions
Question
Use the following financial statements of Precision Co. to complete these requirements.
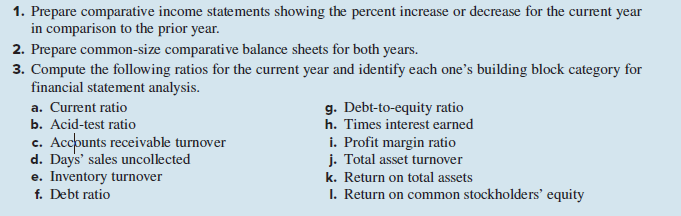
Transcribed Image Text:1. Prepare comparative income statements showing the percent increase or decrease for the current year
in comparison to the prior year.
2. Prepare common-size comparative balance sheets for both years.
3. Compute the following ratios for the current year and identify each one's building block category for
financial statement analysis.
a. Current ratio
g. Debt-to-equity ratio
h. Times interest earned
i. Profit margin ratio
j. Total asset turnover
k. Return on total assets
I. Return on common stockholders' equity
b. Acid-test ratio
Accpunts receivable turnover
d. Days' sales uncollected
e. Inventory turnover
c.
f. Debt ratio
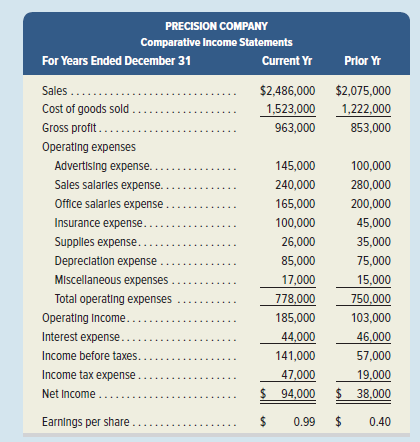
Transcribed Image Text:PRECISION COMPANY
Comparative Income Statements
For Years Ended December 31
Current Yr
Prlor Yr
Sales .....
$2,486,000
$2,075,000
Cost of goods sold ...
Gross profit....
1,523,000
1,222,000
963,000
853,000
Operating expenses
Advertising expense..
Sales salarles expense..
145,000
100,000
240,000
280,000
Office salarles expense.
165,000
200,000
Insurance expense.
100,000
45,000
Supplles expense..
26,000
35,000
Depreciation expense
85,000
75,000
Miscellaneous expenses
17,000
15,000
Total operating expenses
778,000
750,000
Operating Income..
185,000
103,000
Interest expense..
Income before taxes...
Income tax expense .
Net Income .....
44,000
46,000
141,000
57,000
47,000
19,000
$ 38,000
$ 94,000
Earnings per share....
2$
$
0.99
0.40
Expert Solution
This question has been solved!
Explore an expertly crafted, step-by-step solution for a thorough understanding of key concepts.

This is a popular solution!

Trending now
This is a popular solution!

Step by step
Solved in 3 steps with 1 images

Knowledge Booster


Learn more about
Need a deep-dive on the concept behind this application? Look no further. Learn more about this topic, accounting and related others by exploring similar questions and additional content below.Recommended textbooks for you
Managerial Accounting
Accounting
ISBN:
9781337912020
Author:
Carl Warren, Ph.d. Cma William B. Tayler
Publisher:
South-Western College Pub

College Accounting, Chapters 1-27
Accounting
ISBN:
9781337794756
Author:
HEINTZ, James A.
Publisher:
Cengage Learning,

Managerial Accounting
Accounting
ISBN:
9781337912020
Author:
Carl Warren, Ph.d. Cma William B. Tayler
Publisher:
South-Western College Pub
College Accounting, Chapters 1-27
Accounting
ISBN:
9781337794756
Author:
HEINTZ, James A.
Publisher:
Cengage Learning,

Intermediate Financial Management (MindTap Course…
Finance
ISBN:
9781337395083
Author:
Eugene F. Brigham, Phillip R. Daves
Publisher:
Cengage Learning

Managerial Accounting: The Cornerstone of Busines…
Accounting
ISBN:
9781337115773
Author:
Maryanne M. Mowen, Don R. Hansen, Dan L. Heitger
Publisher:
Cengage Learning