1. Response insurance collects data on seat-belt usage among U.S. drivers. Of 2 34 years old, 25% said that they buckled up, whereas 1658 of 2400 drivers said that they did. (a) At the 5% significance level, do the data suggest that the population prop years old drivers who buckle up is greater than the population proportion old drivers who buckle up? Step 1: Definition of variable Pi = P2 = Step 2: Find sample size, number of successes, and sample proportion from sample size: n = %3D sample size: n, = %3D number of successes: x, = %3D number of successes: x, = %3D sample proportion: p, == %3D !! X2 sample proportion: ê2 !! X, +x2 sample pooled proportion: ê, %3D п +п, ||

Holt Mcdougal Larson Pre-algebra: Student Edition 2012
1st Edition
ISBN:9780547587776
Author:HOLT MCDOUGAL
Publisher:HOLT MCDOUGAL
Chapter11: Data Analysis And Probability
Section: Chapter Questions
Problem 8CR
icon
Related questions
icon
Concept explainers
Topic Video
Question
100%
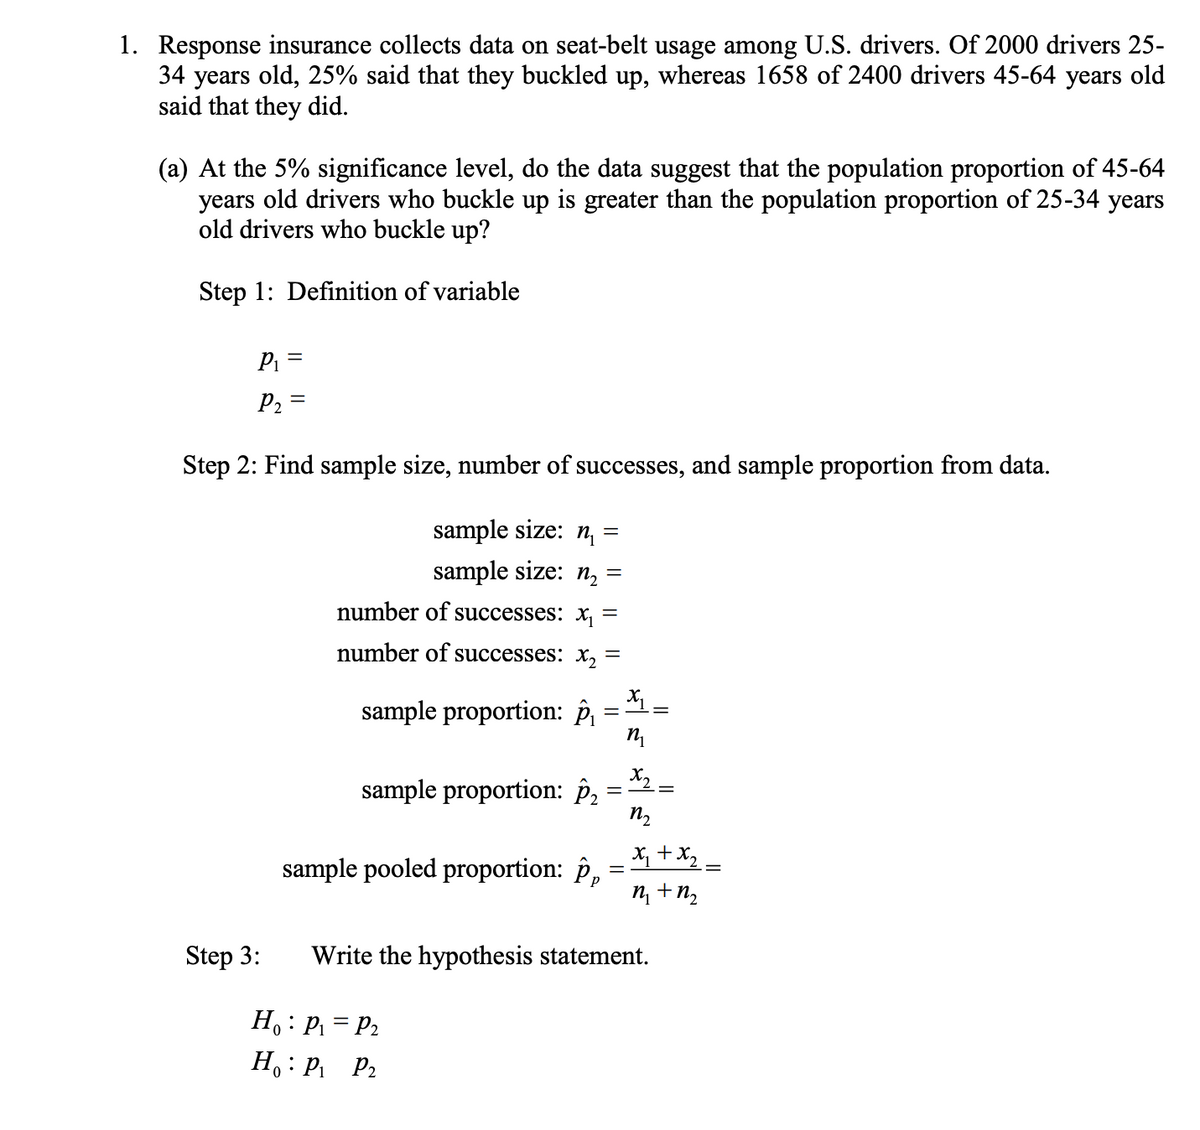
1. Response insurance collects data on seat-belt usage among U.S. drivers. Of 2000 drivers 25-
34 years old, 25% said that they buckled up, whereas 1658 of 2400 drivers 45-64 years old
said that they did.
(a) At the 5% significance level, do the data suggest that the population proportion of 45-64
years old drivers who buckle up is greater than the population proportion of 25-34 years
old drivers who buckle up?
Step 1: Definition of variable
P =
P2 =
Step 2: Find sample size, number of successes, and sample proportion from data.
sample size: n
sample size: n, =
number of successes: x,
X,
sample proportion: , :
sample proportion: p,
X, +X2 =
sample pooled proportion: p,
n +n,
Step 3:
Write the hypothesis statement.
H, : P = P2
H, : P P2
Transcribed Image Text:1. Response insurance collects data on seat-belt usage among U.S. drivers. Of 2000 drivers 25- 34 years old, 25% said that they buckled up, whereas 1658 of 2400 drivers 45-64 years old said that they did. (a) At the 5% significance level, do the data suggest that the population proportion of 45-64 years old drivers who buckle up is greater than the population proportion of 25-34 years old drivers who buckle up? Step 1: Definition of variable P = P2 = Step 2: Find sample size, number of successes, and sample proportion from data. sample size: n sample size: n, = number of successes: x, number of successes: x, X, sample proportion: , : sample proportion: p, X, +X2 = sample pooled proportion: p, n +n, Step 3: Write the hypothesis statement. H, : P = P2 H, : P P2
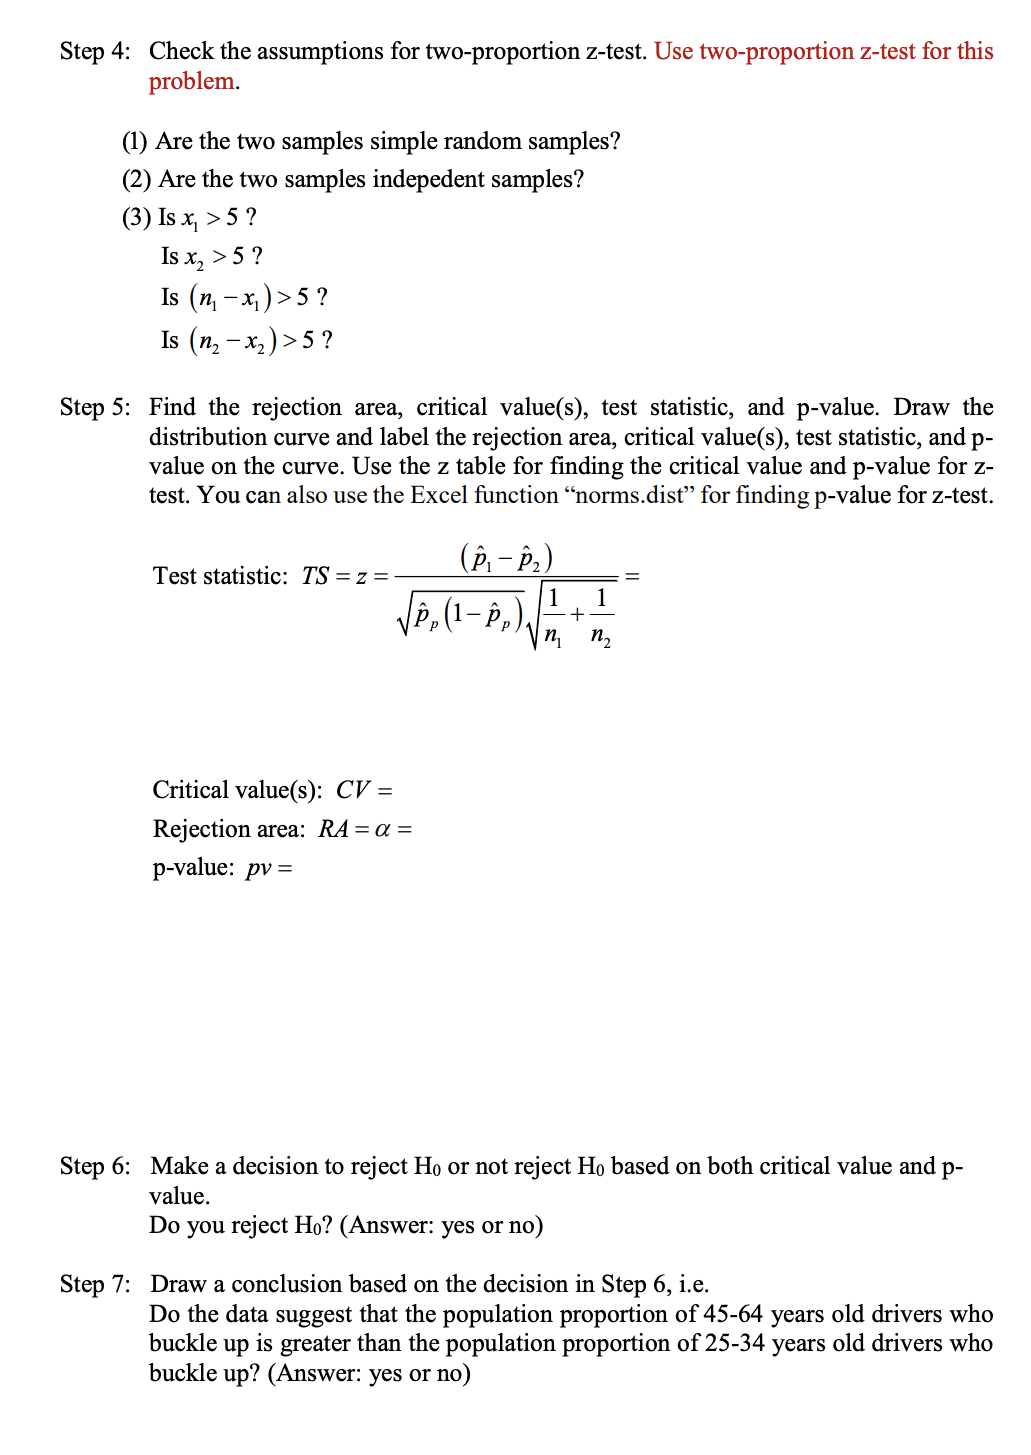
Step 4: Check the assumptions for two-proportion z-test. Use two-proportion z-test for this
problem.
(1) Are the two samples simple random samples?
(2) Are the two samples indepedent samples?
(3) Is x, > 5 ?
Is x, > 5 ?
Is (п, - х,)>5?
Is (п, — х,) >5?
Step 5: Find the rejection area, critical value(s), test statistic, and p-value. Draw the
distribution curve and label the rejection area, critical value(s), test statistic, and p-
value on the curve. Use the z table for finding the critical value and p-value for z-
test. You can also use the Excel function "norms.dist" for finding p-value for z-test.
(P, – P.)
Test statistic: TS = z =
VP,(1- P,),
1
1
-+
n,
п,
Critical value(s): CV =
Rejection area: RA= a =
p-value: pv =
Step 6: Make a decision to reject Ho or not reject Ho based on both critical value and p-
value.
Do you reject Ho? (Answer: yes or no)
Step 7: Draw a conclusion based on the decision in Step 6, i.e.
Do the data suggest that the population proportion of 45-64 years old drivers who
buckle
up
is
greater than the population proportion of 25-34 years old drivers who
buckle up? (Answer: yes or no)
Transcribed Image Text:Step 4: Check the assumptions for two-proportion z-test. Use two-proportion z-test for this problem. (1) Are the two samples simple random samples? (2) Are the two samples indepedent samples? (3) Is x, > 5 ? Is x, > 5 ? Is (п, - х,)>5? Is (п, — х,) >5? Step 5: Find the rejection area, critical value(s), test statistic, and p-value. Draw the distribution curve and label the rejection area, critical value(s), test statistic, and p- value on the curve. Use the z table for finding the critical value and p-value for z- test. You can also use the Excel function "norms.dist" for finding p-value for z-test. (P, – P.) Test statistic: TS = z = VP,(1- P,), 1 1 -+ n, п, Critical value(s): CV = Rejection area: RA= a = p-value: pv = Step 6: Make a decision to reject Ho or not reject Ho based on both critical value and p- value. Do you reject Ho? (Answer: yes or no) Step 7: Draw a conclusion based on the decision in Step 6, i.e. Do the data suggest that the population proportion of 45-64 years old drivers who buckle up is greater than the population proportion of 25-34 years old drivers who buckle up? (Answer: yes or no)
Expert Solution
trending now

Trending now

This is a popular solution!

steps

Step by step

Solved in 5 steps with 5 images

Blurred answer
Knowledge Booster
Centre, Spread, and Shape of a Distribution
Learn more about
Need a deep-dive on the concept behind this application? Look no further. Learn more about this topic, statistics and related others by exploring similar questions and additional content below.
Recommended textbooks for you
Holt Mcdougal Larson Pre-algebra: Student Edition…
Algebra
ISBN:
9780547587776
Author:
HOLT MCDOUGAL
Publisher:
HOLT MCDOUGAL
Glencoe Algebra 1, Student Edition, 9780079039897…
Algebra
ISBN:
9780079039897
Author:
Carter
Publisher:
McGraw Hill
College Algebra (MindTap Course List)
Algebra
ISBN:
9781305652231
Author:
R. David Gustafson, Jeff Hughes
Publisher:
Cengage Learning