1). Suppose that a normal population has mean u and standard deviation ơ = 0.5. How large a sample is needed so that a 2-sided 95% confidence interval for u has length L = 0.2643? A. 15 В. 28 С. 55 D. 220
1). Suppose that a normal population has mean u and standard deviation ơ = 0.5. How large a sample is needed so that a 2-sided 95% confidence interval for u has length L = 0.2643? A. 15 В. 28 С. 55 D. 220

MATLAB: An Introduction with Applications
6th Edition
ISBN:9781119256830
Author:Amos Gilat
Publisher:Amos Gilat
Chapter1: Starting With Matlab
Section: Chapter Questions
Problem 1P

Related questions

Question
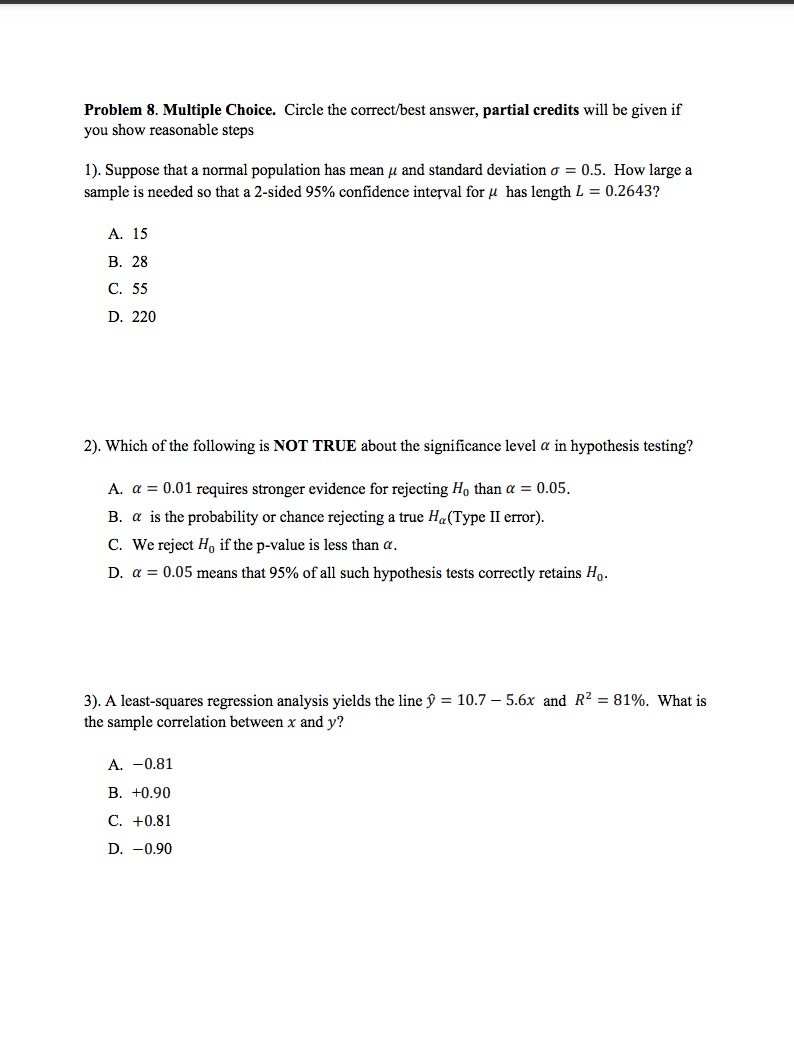
Transcribed Image Text:Problem 8. Multiple Choice. Circle the correct/best answer, partial credits will be given if
you show reasonable steps
1). Suppose that a normal population has mean u and standard deviation o = 0.5. How large a
sample is needed so that a 2-sided 95% confidence interval for u has length L = 0.2643?
A. 15
В. 28
С. 55
D. 220
2). Which of the following is NOT TRUE about the significance level a in hypothesis testing?
A. a = 0.01 requires stronger evidence for rejecting Ho than a = 0.05.
B. a is the probability or chance rejecting a true H«(Type II error).
C. We reject Ho if the p-value is less than a.
D. a = 0.05 means that 95% of all such hypothesis tests correctly retains Ho.
3). A least-squares regression analysis yields the line ŷ = 10.7 - 5.6x and R² = 81%. What is
the sample correlation between x and y?
A. -0.81
В. +0.90
C. +0.81
D. -0.90
Expert Solution
This question has been solved!
Explore an expertly crafted, step-by-step solution for a thorough understanding of key concepts.

This is a popular solution!

Trending now
This is a popular solution!

Step by step
Solved in 2 steps with 3 images

Knowledge Booster


Learn more about
Need a deep-dive on the concept behind this application? Look no further. Learn more about this topic, statistics and related others by exploring similar questions and additional content below.Recommended textbooks for you
MATLAB: An Introduction with Applications
Statistics
ISBN:
9781119256830
Author:
Amos Gilat
Publisher:
John Wiley & Sons Inc

Probability and Statistics for Engineering and th…
Statistics
ISBN:
9781305251809
Author:
Jay L. Devore
Publisher:
Cengage Learning

Statistics for The Behavioral Sciences (MindTap C…
Statistics
ISBN:
9781305504912
Author:
Frederick J Gravetter, Larry B. Wallnau
Publisher:
Cengage Learning
MATLAB: An Introduction with Applications
Statistics
ISBN:
9781119256830
Author:
Amos Gilat
Publisher:
John Wiley & Sons Inc
Probability and Statistics for Engineering and th…
Statistics
ISBN:
9781305251809
Author:
Jay L. Devore
Publisher:
Cengage Learning
Statistics for The Behavioral Sciences (MindTap C…
Statistics
ISBN:
9781305504912
Author:
Frederick J Gravetter, Larry B. Wallnau
Publisher:
Cengage Learning

Elementary Statistics: Picturing the World (7th E…
Statistics
ISBN:
9780134683416
Author:
Ron Larson, Betsy Farber
Publisher:
PEARSON

The Basic Practice of Statistics
Statistics
ISBN:
9781319042578
Author:
David S. Moore, William I. Notz, Michael A. Fligner
Publisher:
W. H. Freeman

Introduction to the Practice of Statistics
Statistics
ISBN:
9781319013387
Author:
David S. Moore, George P. McCabe, Bruce A. Craig
Publisher:
W. H. Freeman