1. Suppose that you have the following data below: Y 1 3 2 5 7 Using either the linear algebra or summation notation formula, find B and B, the OLS estimates of the model
1. Suppose that you have the following data below: Y 1 3 2 5 7 Using either the linear algebra or summation notation formula, find B and B, the OLS estimates of the model

MATLAB: An Introduction with Applications
6th Edition
ISBN:9781119256830
Author:Amos Gilat
Publisher:Amos Gilat
Chapter1: Starting With Matlab
Section: Chapter Questions
Problem 1P

Related questions
Question
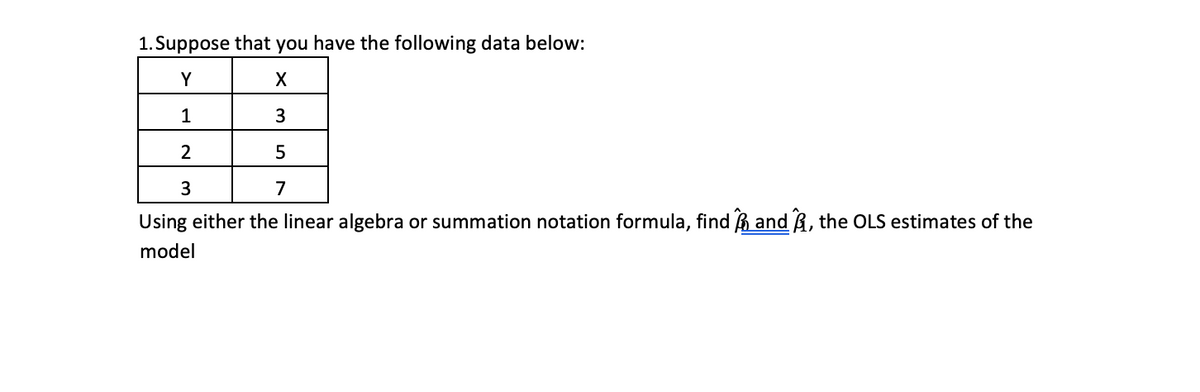
Transcribed Image Text:1. Suppose that you have the following data below:
Y
1
2
5
3
7
Using either the linear algebra or summation notation formula, find B and R, the OLS estimates of the
model
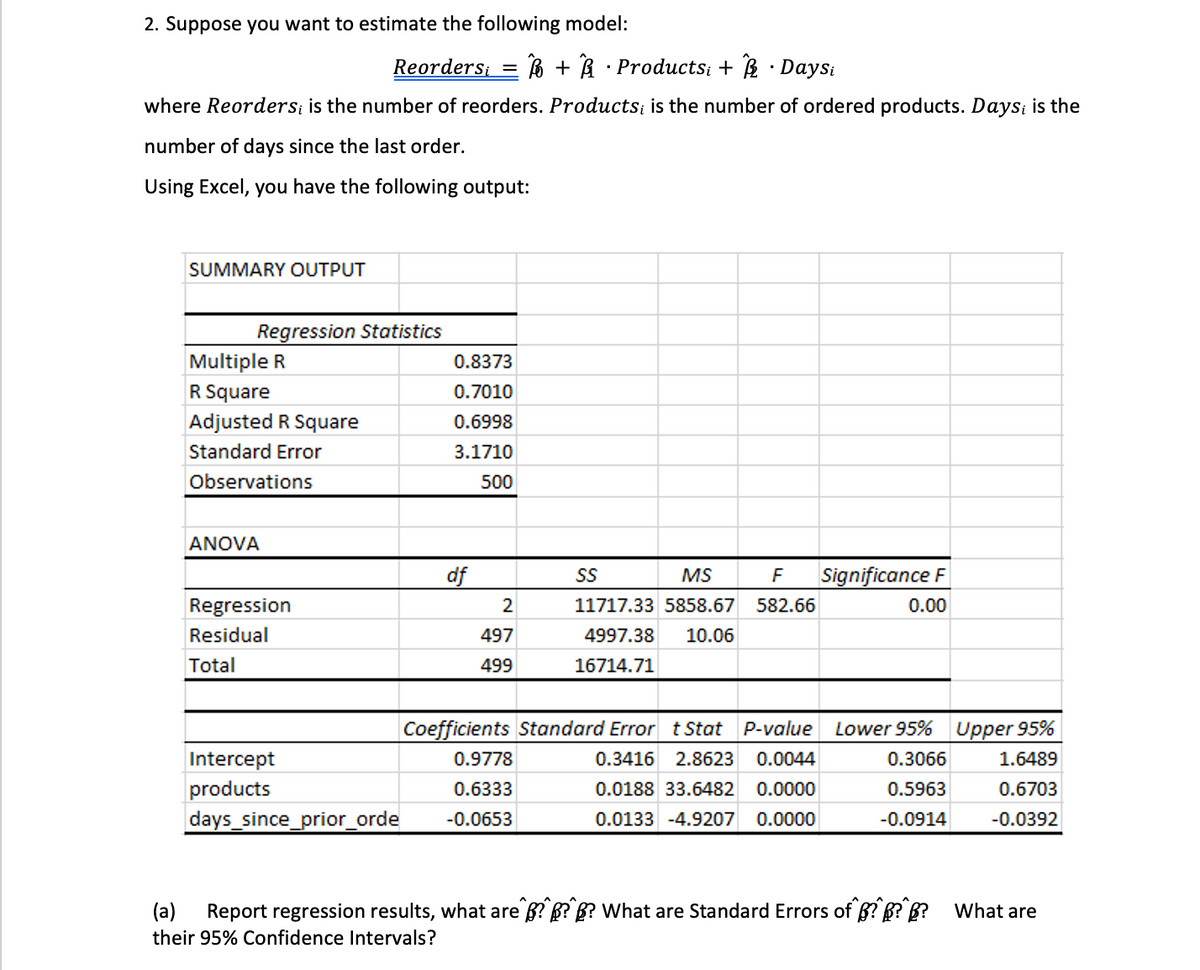
Transcribed Image Text:2. Suppose you want to estimate the following model:
Reorders; =
ß + R · Productsi + B · Daysi
where Reorders; is the number of reorders. Products; is the number of ordered products. Days; is the
number of days since the last order.
Using Excel, you have the following output:
SUMMARY OUTPUT
Regression Statistics
Multiple R
0.8373
R Square
0.7010
Adjusted R Square
Standard Error
0.6998
3.1710
Observations
500
ANOVA
df
MS
Significance F
Regression
2
11717.33 5858.67
582.66
0.00
Residual
497
4997.38
10.06
Total
499
16714.71
Coefficients Standard Error t Stat
P-value
Lower 95% Upper 95%
Intercept
0.9778
0.3416 2.8623
0.0044
0.3066
1.6489
products
0.6333
0.0188 33.6482 0.0000
0.5963
0.6703
days_since_prior_orde
-0.0653
0.0133 -4.9207
0.0000
-0.0914
-0.0392
(a)
Report regression results, what are B? B? B? What are Standard Errors of B? R? B? What are
their 95% Confidence Intervals?
Expert Solution
This question has been solved!
Explore an expertly crafted, step-by-step solution for a thorough understanding of key concepts.

Step by step
Solved in 2 steps with 2 images

Recommended textbooks for you
MATLAB: An Introduction with Applications
Statistics
ISBN:
9781119256830
Author:
Amos Gilat
Publisher:
John Wiley & Sons Inc

Probability and Statistics for Engineering and th…
Statistics
ISBN:
9781305251809
Author:
Jay L. Devore
Publisher:
Cengage Learning

Statistics for The Behavioral Sciences (MindTap C…
Statistics
ISBN:
9781305504912
Author:
Frederick J Gravetter, Larry B. Wallnau
Publisher:
Cengage Learning
MATLAB: An Introduction with Applications
Statistics
ISBN:
9781119256830
Author:
Amos Gilat
Publisher:
John Wiley & Sons Inc
Probability and Statistics for Engineering and th…
Statistics
ISBN:
9781305251809
Author:
Jay L. Devore
Publisher:
Cengage Learning
Statistics for The Behavioral Sciences (MindTap C…
Statistics
ISBN:
9781305504912
Author:
Frederick J Gravetter, Larry B. Wallnau
Publisher:
Cengage Learning

Elementary Statistics: Picturing the World (7th E…
Statistics
ISBN:
9780134683416
Author:
Ron Larson, Betsy Farber
Publisher:
PEARSON

The Basic Practice of Statistics
Statistics
ISBN:
9781319042578
Author:
David S. Moore, William I. Notz, Michael A. Fligner
Publisher:
W. H. Freeman

Introduction to the Practice of Statistics
Statistics
ISBN:
9781319013387
Author:
David S. Moore, George P. McCabe, Bruce A. Craig
Publisher:
W. H. Freeman