1. Suppose the following scatterplot shows data relating the number of visitors at Richmond Beach, y, on a day with a high temperature of x, in degrees Fahrenheit. The best fit line/regression line has the equation y = 14.89x – 530.6. y 800- 700- 600 a. Do you expect the correlation between the high temperature and number of visitors to be closer to 1,0, or -1? Briefly explain. 500 400- 300 b. Explain the meaning of the slope of the regression line in terms of the high temperature and the number of visitors that day. 200- 100- 40 50 60 70 80 90 Hlgh temperature X c. What does the model predict for the number of visitors on a day with a high temperature of 80 degrees F? Include units in your answer. d. The actual number of visitors on the 80 degrees F day was 780. Find the residual for that day. Does the model give an overestimate or an underestimate for that day? Number of visitors
1. Suppose the following scatterplot shows data relating the number of visitors at Richmond Beach, y, on a day with a high temperature of x, in degrees Fahrenheit. The best fit line/regression line has the equation y = 14.89x – 530.6. y 800- 700- 600 a. Do you expect the correlation between the high temperature and number of visitors to be closer to 1,0, or -1? Briefly explain. 500 400- 300 b. Explain the meaning of the slope of the regression line in terms of the high temperature and the number of visitors that day. 200- 100- 40 50 60 70 80 90 Hlgh temperature X c. What does the model predict for the number of visitors on a day with a high temperature of 80 degrees F? Include units in your answer. d. The actual number of visitors on the 80 degrees F day was 780. Find the residual for that day. Does the model give an overestimate or an underestimate for that day? Number of visitors

College Algebra
7th Edition
ISBN:9781305115545
Author:James Stewart, Lothar Redlin, Saleem Watson
Publisher:James Stewart, Lothar Redlin, Saleem Watson
Chapter1: Equations And Graphs
Section: Chapter Questions
Problem 10T: Olympic Pole Vault The graph in Figure 7 indicates that in recent years the winning Olympic men’s...

Related questions

Question
Answer D
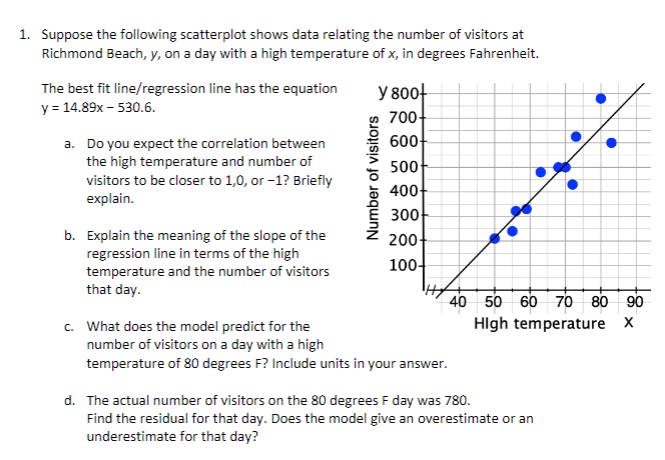
Transcribed Image Text:1. Suppose the following scatterplot shows data relating the number of visitors at
Richmond Beach, y, on a day with a high temperature of x, in degrees Fahrenheit.
The best fit line/regression line has the equation
y = 14.89x – 530.6.
y 800-
700-
600
a. Do you expect the correlation between
the high temperature and number of
visitors to be closer to 1,0, or -1? Briefly
explain.
500
400-
300
b. Explain the meaning of the slope of the
regression line in terms of the high
temperature and the number of visitors
that day.
200-
100-
40 50 60 70 80 90
Hlgh temperature X
c. What does the model predict for the
number of visitors on a day with a high
temperature of 80 degrees F? Include units in your answer.
d. The actual number of visitors on the 80 degrees F day was 780.
Find the residual for that day. Does the model give an overestimate or an
underestimate for that day?
Number of visitors
Expert Solution
This question has been solved!
Explore an expertly crafted, step-by-step solution for a thorough understanding of key concepts.

This is a popular solution!

Trending now
This is a popular solution!

Step by step
Solved in 2 steps with 2 images

Knowledge Booster


Learn more about
Need a deep-dive on the concept behind this application? Look no further. Learn more about this topic, statistics and related others by exploring similar questions and additional content below.Recommended textbooks for you
College Algebra
Algebra
ISBN:
9781305115545
Author:
James Stewart, Lothar Redlin, Saleem Watson
Publisher:
Cengage Learning

Glencoe Algebra 1, Student Edition, 9780079039897…
Algebra
ISBN:
9780079039897
Author:
Carter
Publisher:
McGraw Hill

Big Ideas Math A Bridge To Success Algebra 1: Stu…
Algebra
ISBN:
9781680331141
Author:
HOUGHTON MIFFLIN HARCOURT
Publisher:
Houghton Mifflin Harcourt
College Algebra
Algebra
ISBN:
9781305115545
Author:
James Stewart, Lothar Redlin, Saleem Watson
Publisher:
Cengage Learning
Glencoe Algebra 1, Student Edition, 9780079039897…
Algebra
ISBN:
9780079039897
Author:
Carter
Publisher:
McGraw Hill
Big Ideas Math A Bridge To Success Algebra 1: Stu…
Algebra
ISBN:
9781680331141
Author:
HOUGHTON MIFFLIN HARCOURT
Publisher:
Houghton Mifflin Harcourt