The following data on price ($) and the overall score for 6 stereo headphones that were tested by Consumer Reports were as follows. The estimated regression equation for these data is y = 23.97 +0.313r. Brand Price Score Bose 190 78 Scullcandy 160 73 Koss 95 69 Phillips/O'Neill 80 57 Denon 70 40 JVC 45 27 a. Does the t test indicate a significant relationship between price and the overall score? Compute the value of the t test statistic. Use a = 0.05 t = (to 2 decimal places.) Use Table 2 of Appendix B to find the p-value. The p-value is - Select your answer What is your conclusion? Use a = 0.05. - Select your answer - b. Test for a significant relationship using the F test. Use Table 4 of Appendix B. p-value is - Select your answer - v What is your conclusion? Use a = 0.05. Because p-value is - Select your answer - v 0.05, we - Select your answer - v Ho : Bi is - Select your answer - c. Show the ANOVA table for these data. Round your answers to three decimal places, if necessary. Do not round intermediate calculations. Source of Sum of Degrees of Variation Squares Freedom Mean Square F p-value (to 4 decimals) Regression Error Total
The following data on price ($) and the overall score for 6 stereo headphones that were tested by Consumer Reports were as follows. The estimated regression equation for these data is y = 23.97 +0.313r. Brand Price Score Bose 190 78 Scullcandy 160 73 Koss 95 69 Phillips/O'Neill 80 57 Denon 70 40 JVC 45 27 a. Does the t test indicate a significant relationship between price and the overall score? Compute the value of the t test statistic. Use a = 0.05 t = (to 2 decimal places.) Use Table 2 of Appendix B to find the p-value. The p-value is - Select your answer What is your conclusion? Use a = 0.05. - Select your answer - b. Test for a significant relationship using the F test. Use Table 4 of Appendix B. p-value is - Select your answer - v What is your conclusion? Use a = 0.05. Because p-value is - Select your answer - v 0.05, we - Select your answer - v Ho : Bi is - Select your answer - c. Show the ANOVA table for these data. Round your answers to three decimal places, if necessary. Do not round intermediate calculations. Source of Sum of Degrees of Variation Squares Freedom Mean Square F p-value (to 4 decimals) Regression Error Total

Chapter4: Linear Functions
Section: Chapter Questions
Problem 30PT: For the following exercises, use Table 4 which shows the percent of unemployed persons 25 years or...

Related questions
Question
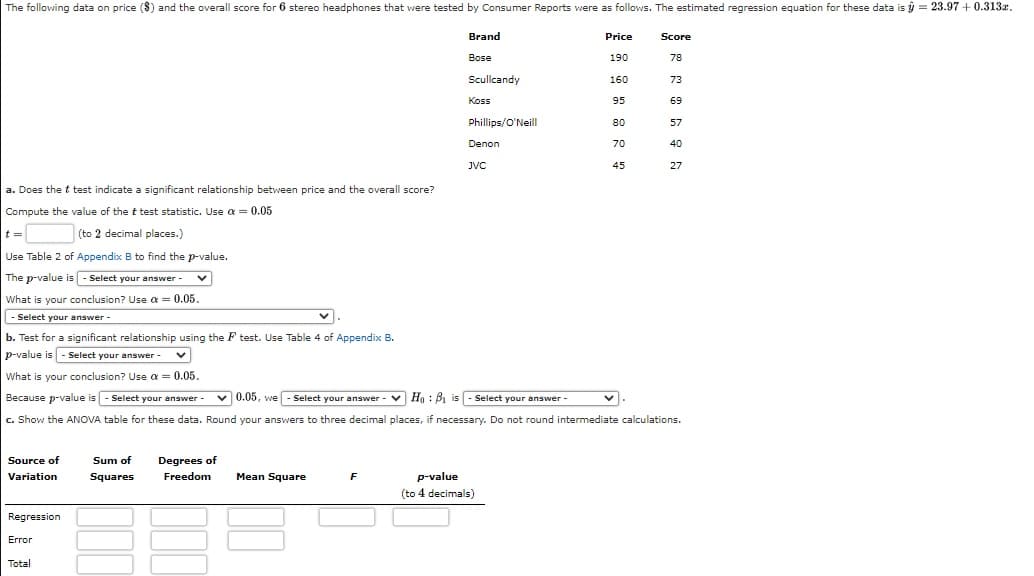
Transcribed Image Text:The following data on price ($) and the overall score for 6 stereo headphones that were tested by Consumer Reports were as follows. The estimated regression equation for these data is ý = 23.97 +0.313r.
Brand
Price
Score
Bose
190
78
Scullcandy
160
73
Koss
95
69
Phillips/O'Neill
80
57
Denon
70
40
JVC
45
27
a. Does the t test indicate a significant relationship between price and the overall score?
Compute the value of the t test statistic. Use a = 0.05
t =
(to 2 decimal places.)
Use Table 2 of Appendix B to find the p-value.
The p-value is - Select your answer -
What is your conclusion? Use a = 0.05.
Select your answer -
b. Test for a significant relationship using the F test. Use Table 4 of Appendix B.
p-value is - Select your answer
What is your conclusion? Use a = 0.05.
Because p-value is - Select your answer -
v 0.05, we - Select your answer - v Ho : Bị is - Select your answer-
ranswe
v.
c. Show the ANOVA table for these data. Round your answers to three decimal places, if necessary. Do not round intermediate calculations.
Source of
Sum of
Degrees of
Variation
Squares
Freedom
Mean Square
F
p-value
(to 4 decimals)
Regression
Error
Total
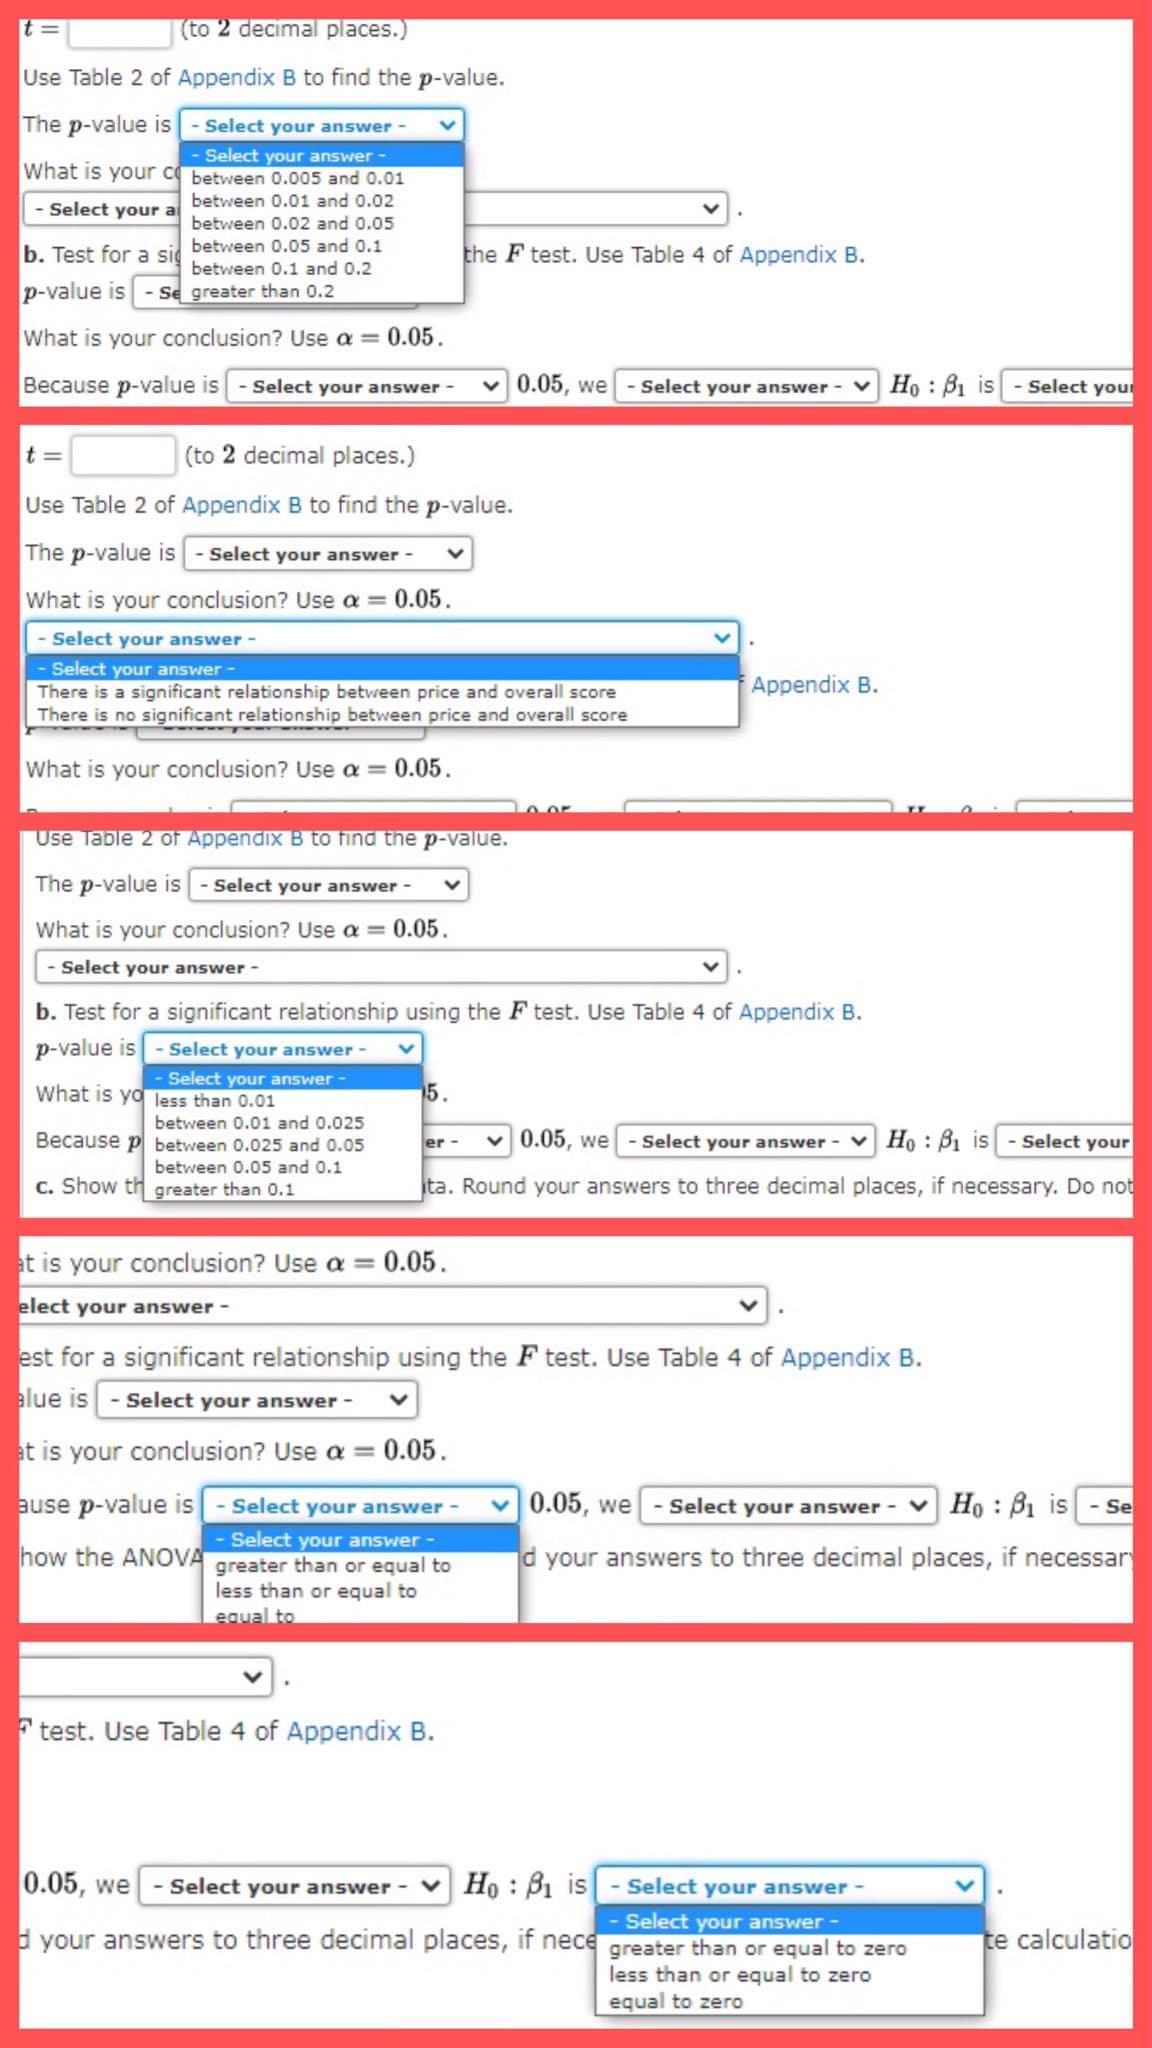
Transcribed Image Text:t =
(to 2 decimal places.)
Use Table 2 of Appendix B to find the p-value.
The p-value is- Select your answer -
- Select your answer -
What is your c between 0.005 and 0.01
between 0.01 and 0.02
- Select your a
between 0.02 and 0.05
b. Test for a sid between 0.05 and 0.1
between 0.1 and 0.2
the F test. Use Table 4 of Appendix B.
p-value is- Se greater than 0.2
What is your conclusion? Use a = 0.05.
Because p-value is
- Select your answer
v 0.05, we - Select your answer -
Ho : B1 is
- Select you
t =
(to 2 decimal places.)
Use Table 2 of Appendix B to find the p-value.
The p-value is - Select your answer -
What is your conclusion? Use a = 0.05.
- Select your answer -
- Select your answer -
There is a significant relationship between price and overall score
There is no significant relationship between price and overall score
Appendix B.
What is your conclusion? Use a = 0.05.
Use Table 2 of Appendix B to find the p-value.
The p-value is- Select your answer -
What is your conclusion? Use a = 0.05.
Select your answer -
b. Test for a significant relationship using the F test. Use Table 4 of Appendix B.
p-value is- Select your answer-
Select your answer-
What is yo less than 0.01
15.
between 0.01 and 0.025
Because p between 0.025 and 0.05
er -
v 0.05, we - Select your answer v Ho: B1 is - Select your
between 0.05 and 0.1
c. Show th greater than 0.1
ta. Round your answers to three decimal places, if necessary. Do not
at is your conclusion? Use a = 0.05.
elect your answer
est for a significant relationship using the F test. Use Table 4 of Appendix B.
alue is - Select your answer -
at is your conclusion? Use a = 0.05.
ause p-value is- Select your answer-
0.05, we
Select your answer - v Ho : B1
is
- Se
Select your answer-
greater than or equal to
less than or equal to
equal to
how the ANOVA
d your answers to three decimal places, if necessar
test. Use Table 4 of Appendix B.
0.05, we
Select your answer
Ho : B1 is
Select your answer -
- Select your answer -
d your answers to three decimal places, if nece greater than or equal to zero
te calculatio
less than or equal to zero
equal to zero
Expert Solution
This question has been solved!
Explore an expertly crafted, step-by-step solution for a thorough understanding of key concepts.

This is a popular solution!

Trending now
This is a popular solution!

Step by step
Solved in 4 steps with 1 images

Recommended textbooks for you


Glencoe Algebra 1, Student Edition, 9780079039897…
Algebra
ISBN:
9780079039897
Author:
Carter
Publisher:
McGraw Hill
Glencoe Algebra 1, Student Edition, 9780079039897…
Algebra
ISBN:
9780079039897
Author:
Carter
Publisher:
McGraw Hill

Functions and Change: A Modeling Approach to Coll…
Algebra
ISBN:
9781337111348
Author:
Bruce Crauder, Benny Evans, Alan Noell
Publisher:
Cengage Learning

Big Ideas Math A Bridge To Success Algebra 1: Stu…
Algebra
ISBN:
9781680331141
Author:
HOUGHTON MIFFLIN HARCOURT
Publisher:
Houghton Mifflin Harcourt