The following are the intelligence quotients (IQ) and the grade point average (GPA) of incoming Grade 12 students. If a significan elationship exists between the variables, perform a regression analysis. What GPA will students A and B obtain if their IQs are 15 and 92, respectively? Support your answer with computations/tables and draw the corresponding scatter diagram. Student IQ GPA 1 153 94 2 120 87 108 89 4 135 93 97 85 110 86 7 155 95 126 88 122 86 10 94 84
The following are the intelligence quotients (IQ) and the grade point average (GPA) of incoming Grade 12 students. If a significan elationship exists between the variables, perform a regression analysis. What GPA will students A and B obtain if their IQs are 15 and 92, respectively? Support your answer with computations/tables and draw the corresponding scatter diagram. Student IQ GPA 1 153 94 2 120 87 108 89 4 135 93 97 85 110 86 7 155 95 126 88 122 86 10 94 84

MATLAB: An Introduction with Applications
6th Edition
ISBN:9781119256830
Author:Amos Gilat
Publisher:Amos Gilat
Chapter1: Starting With Matlab
Section: Chapter Questions
Problem 1P

Related questions
Question
100%
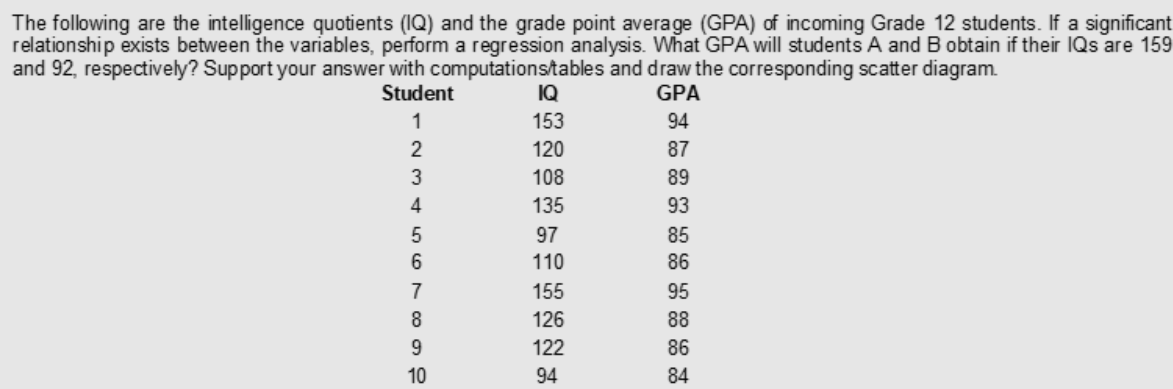
Transcribed Image Text:The following are the intelligence quotients (IQ) and the grade point average (GPA) of incoming Grade 12 students. If a significant
relationship exists between the variables, perform a regression analysis. What GPA will students A and B obtain if their IQs are 159
and 92, respectively? Support your answer with computations/tables and draw the corresponding scatter diagram.
Student
IQ
GPA
1
153
94
120
87
108
89
135
93
97
85
110
86
155
95
126
88
122
86
10
94
84
23455 6 7 8 9은
Expert Solution
This question has been solved!
Explore an expertly crafted, step-by-step solution for a thorough understanding of key concepts.

Step by step
Solved in 2 steps with 1 images

Recommended textbooks for you
MATLAB: An Introduction with Applications
Statistics
ISBN:
9781119256830
Author:
Amos Gilat
Publisher:
John Wiley & Sons Inc

Probability and Statistics for Engineering and th…
Statistics
ISBN:
9781305251809
Author:
Jay L. Devore
Publisher:
Cengage Learning

Statistics for The Behavioral Sciences (MindTap C…
Statistics
ISBN:
9781305504912
Author:
Frederick J Gravetter, Larry B. Wallnau
Publisher:
Cengage Learning
MATLAB: An Introduction with Applications
Statistics
ISBN:
9781119256830
Author:
Amos Gilat
Publisher:
John Wiley & Sons Inc
Probability and Statistics for Engineering and th…
Statistics
ISBN:
9781305251809
Author:
Jay L. Devore
Publisher:
Cengage Learning
Statistics for The Behavioral Sciences (MindTap C…
Statistics
ISBN:
9781305504912
Author:
Frederick J Gravetter, Larry B. Wallnau
Publisher:
Cengage Learning

Elementary Statistics: Picturing the World (7th E…
Statistics
ISBN:
9780134683416
Author:
Ron Larson, Betsy Farber
Publisher:
PEARSON

The Basic Practice of Statistics
Statistics
ISBN:
9781319042578
Author:
David S. Moore, William I. Notz, Michael A. Fligner
Publisher:
W. H. Freeman

Introduction to the Practice of Statistics
Statistics
ISBN:
9781319013387
Author:
David S. Moore, George P. McCabe, Bruce A. Craig
Publisher:
W. H. Freeman