1. Suppose the utility bills for all Carrollton residents have a mean of $63 and a standard deviation of $11. A researcher draws random samples of 100 households and calculate the mean utility bill for each sample. (a) value, the standard error, and the distribution shape). If the distribution is normal, explain why. Characterize the sampling distribution of the sample mean (the expected (b). What is the probability that the mean of a sample is between $52 and $74?
1. Suppose the utility bills for all Carrollton residents have a mean of $63 and a standard deviation of $11. A researcher draws random samples of 100 households and calculate the mean utility bill for each sample. (a) value, the standard error, and the distribution shape). If the distribution is normal, explain why. Characterize the sampling distribution of the sample mean (the expected (b). What is the probability that the mean of a sample is between $52 and $74?

Glencoe Algebra 1, Student Edition, 9780079039897, 0079039898, 2018
18th Edition
ISBN:9780079039897
Author:Carter
Publisher:Carter
Chapter10: Statistics
Section10.4: Distributions Of Data
Problem 19PFA

Related questions
Question
Please help with this Q
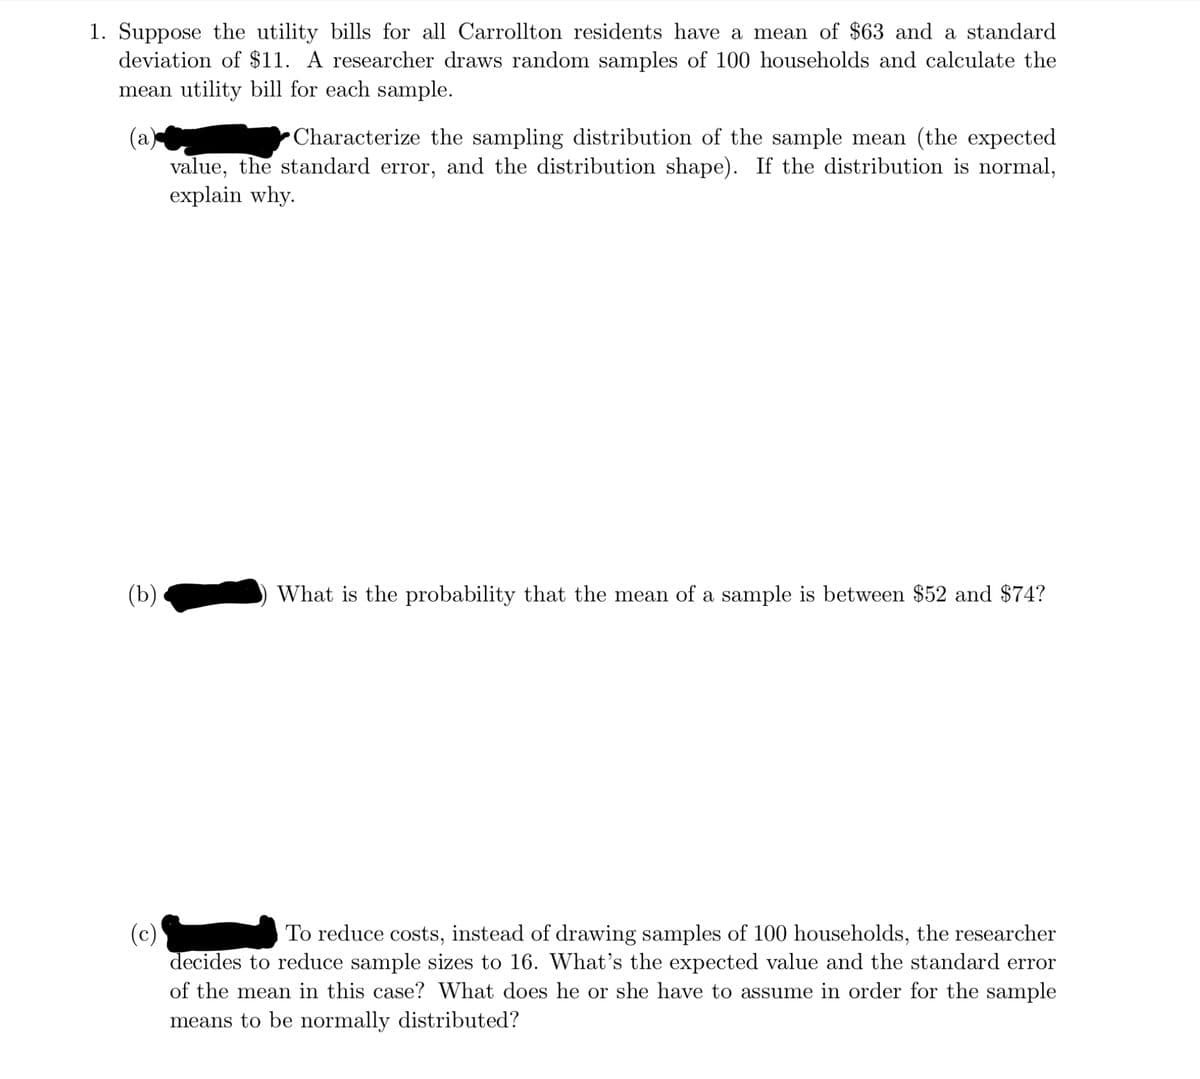
Transcribed Image Text:1. Suppose the utility bills for all Carrollton residents have a mean of $63 and a standard
deviation of $11. A researcher draws random samples of 100 households and calculate the
mean utility bill for each sample.
(a)
value, the standard error, and the distribution shape). If the distribution is normal,
explain why.
Characterize the sampling distribution of the sample mean (the expected
(b)
What is the probability that the mean of a sample is between $52 and $74?
To reduce costs, instead of drawing samples of 100 households, the researcher
(c)
decides to reduce sample sizes to 16. What's the expected value and the standard error
of the mean in this case? What does he or she have to assume in order for the sample
means to be normally distributed?
Expert Solution
This question has been solved!
Explore an expertly crafted, step-by-step solution for a thorough understanding of key concepts.

This is a popular solution!

Trending now
This is a popular solution!

Step by step
Solved in 2 steps with 2 images

Recommended textbooks for you
Glencoe Algebra 1, Student Edition, 9780079039897…
Algebra
ISBN:
9780079039897
Author:
Carter
Publisher:
McGraw Hill
Glencoe Algebra 1, Student Edition, 9780079039897…
Algebra
ISBN:
9780079039897
Author:
Carter
Publisher:
McGraw Hill