
MATLAB: An Introduction with Applications
6th Edition
ISBN: 9781119256830
Author: Amos Gilat
Publisher: John Wiley & Sons Inc
expand_more
expand_more
format_list_bulleted
Concept explainers
Question

Transcribed Image Text:When attempting to predict job performance using personality traits, researchers typically assume that the
relationship is linear. A study investigated a curvilinear relationship between job task performance and a
specific personality trait-conscientiousness. Using data collected for 602 employees of a large public
organization, task performance was measured on a 30-point scale (where higher scores indicate better
performance) and conscientiousness was measured on a scale of -3 to +3 (where higher scores indicate a
higher level of conscientiousness).
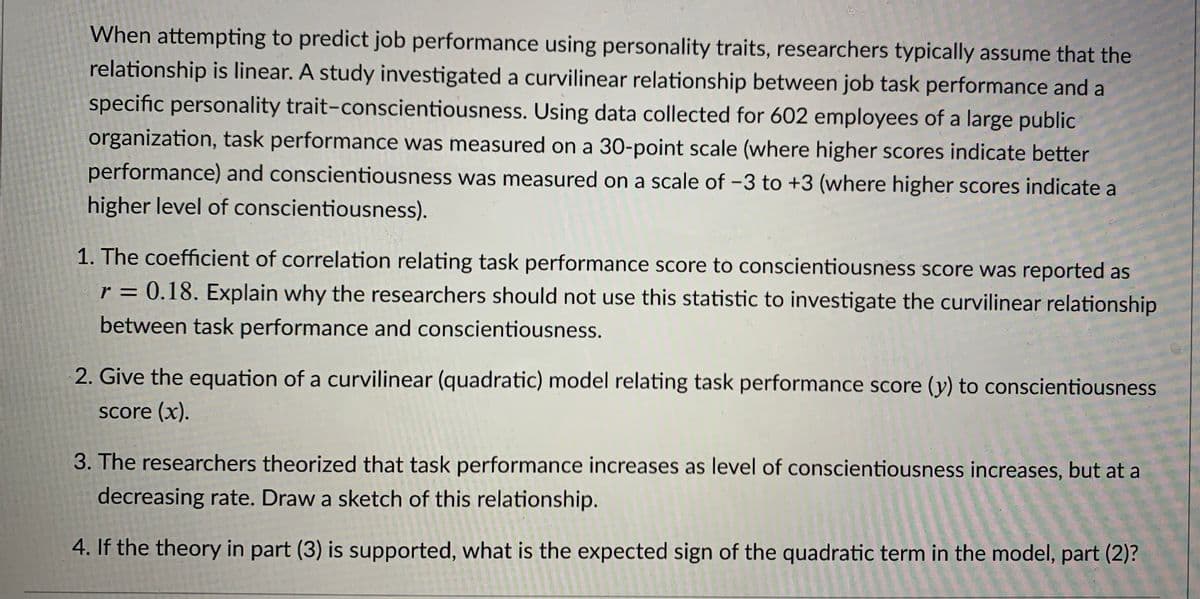
1. The coefficient of correlation relating task performance score to conscientiousness score was reported as
r = 0.18. Explain why the researchers should not use this statistic to investigate the curvilinear relationship
%D
between task performance and conscientiousness.
2. Give the equation of a curvilinear (quadratic) model relating task performance score (y) to conscientiousness
Score (x).
3. The researchers theorized that task performance increases as level of conscientiousness increases, but at a
decreasing rate. Draw a sketch of this relationship.
4. If the theory in part (3) is supported, what is the expected sign of the quadratic term in the model, part (2)?
Expert Solution

This question has been solved!
Explore an expertly crafted, step-by-step solution for a thorough understanding of key concepts.
Step by stepSolved in 2 steps with 1 images

Knowledge Booster
Learn more about
Need a deep-dive on the concept behind this application? Look no further. Learn more about this topic, statistics and related others by exploring similar questions and additional content below.Similar questions
- Wrinkle recovery angle and tensile strength are the two most important characteristics for evaluating the performance of crosslinked cotton fabric. An increase in the degree of crosslinking, as determined by ester carboxyl band absorbance, improves the wrinkle resistance of the fabric (at the expense of reducing mechanical strength). The accompanying data on x = absorbance and y = wrinkle resistance angle was read from a graph in the paper "Predicting the Performance of Durable Press Finished Cotton Fabric with Infrared Spectroscopy".† x 0.115 0.126 0.183 0.246 0.282 0.344 0.355 0.452 0.491 0.554 0.651 y 334 342 355 363 365 372 381 392 400 412 420 Here is regression output from Minitab: Predictor Constant absorb S = 3.60498 Coef 321.878 156.711 SOURCE Regression Residual Error Total SE Coef 2.483 6.464 R-Sq = 98.5% DF 1 9 10 SS 7639.0 117.0 7756.0 T 129.64 24.24 0.000 0.000 R-Sq (adj) = 98.3% MS 7639.0 13.0 F P 587.81 (a) Does the simple linear regression model appear to be…arrow_forwardA researcher plans to study the causal effect of police on crime using data from a random sample of U.K. counties. He plans to regress the county’s crime rate on the (per capita) size of the county’s police force. Explain why this regression is likely to suffer from omitted variable bias. Which variable would you add to the regression to controlfor important omitted variable? Determine whether the regression will likely over or underestimate the effect of police on the crime rate?arrow_forwardA recent study showed that the hours a person exercised in a week affected the individual'sresting heart rate. It was computed that r = -.68 and the least squares regression line was?̂ = 83-1.4x, where x is the hours exercised and y is the resting heart rate. d. What percentage of variability in resting heart rate can be explained by variability inhours exercised?arrow_forward
- This dataset continues our saga of modeling the price of this popular Honda automobile. The dataset has now been cleaned to remove the columns with the dealership where the car was offered for sale and specific trim. (a) write out your model in econometric notation. Be very precise! (b) using the 93 observations in the dataset, estimate a model where price is a function of age, mileage and trim of the car. Be sure to avoid the dummy variable trap!! Fully report the results of your model. In this case, interpretation of the coefficients on the dummy variables is particularly important. (c) test the hypothesis that the specific trim does not affect the price of a Civic. Be sure to do all parts of the hypothesis test. (please fully describe steps if you are using Excel) Price Years Old KM EX EXT SE Sport Touring 6555 9 290363 0 0 0 0 0 9999 9 142258 0 0 0 0 0 10281 6 132644 0 0 0 0 0 12480 5 167125 0 0 0 0 0 12991 7 57398 0 0 0 0 0 12991 6 93046 0 0 0 0 0 12991…arrow_forwardHormone replacement therapy (HRT) is thought to increase the risk of breast cancer. The accompanying data on x = percent of women using HRT and y = breast cancer incidence (cases per 100,000 women) for a region in Germany for 5 years appeared in the paper "Decline in Breast Cancer Incidence after Decrease in Utilization of Hormone Replacement Therapy." The authors of the paper used a simple linear regression model to describe the relationship between HRT use and breast cancer incidence. t HRT Use Breast Cancer Incidence 46.30 40.60 39.50 36.60 30.00 103.30 105.00 100.00 93.80 83.50 (a) What is the equation of the estimated regression line? (Round your numerical values to four decimal places.) ŷ = (b) What is the estimated average change in breast cancer incidence (in cases per 100,000 women) associated with a 1 percentage point increase in HRT use? (Round your answer to four decimal places.) cases per 100,000 women (c) What breast cancer incidence (in cases per 100,000 women) would be…arrow_forwardc) Show that the coefficient of determination, R², can also be obtained as the squared correlation between actual Y values and the Y values estimated from the regression model where Y is the dependent variable. Note that the coefficient of correlation between Y and X is Eyixi r = And also that ỹ = ŷ (18.75)arrow_forward
- The marketing manager wants to estimate the effect of the MBA program on Salary controlling for the other factors. Which regression model is the MOST appropriate? Oa. Salary = B_0+B_1 MBA + ε Ob. Salary = 3_0+ B_1 MBA + B_2 Work + e c. Salary = B_0+B_1 MBA+B_2 Work + B_3 Age +8 Od. Salary = B_0+ B_1 MBA + B_2 Work + B_3 Age +B_4 Gender + εarrow_forwardThe least-squares regression equation is y=620.6x+16,624 where y is the median income and x is the percentage of 25 years and older with at least a bachelor's degree in the region. The scatter diagram indicates a linear relation between the two variables with a correlation coefficient of 0.7004. Predict the median income of a region in which 30% of adults 25 years and older have at least a bachelor's degree.arrow_forwardProvide an example of a regression that arguably would have a high value of R² but would produce biased and inconsistent estimators of a causal effect. Explain why the R² is likely to be high. Explain why the OLS estimators would be biased and inconsistent.arrow_forward
- The full question for the last question is written down below Fail/fail to reject H0. There is insufficient/sufficient evidence at the 10% level of significance to support the claim that there is a linear relationship between weight and number of hours slept.arrow_forwardThe Wall Street Journal asked Concur Technologies, Inc., an expense management company, to examine data from million expense reports to provide insights regarding business travel expenses. Their analysis of the data showed that New York was the most expensive city. The following table shows the average daily hotel room rate () and the average amount spent on entertainment () for a random sample of of the most-visited U.S. cities. These data lead to the estimated regression equation . For these data . Click on the datafile logo to reference the data. Use Table 1 of Appendix B. full question attached in ss thanks for help aprpeicated aigjrowoirjarrow_forward
arrow_back_ios
arrow_forward_ios
Recommended textbooks for you
- MATLAB: An Introduction with ApplicationsStatisticsISBN:9781119256830Author:Amos GilatPublisher:John Wiley & Sons IncProbability and Statistics for Engineering and th...StatisticsISBN:9781305251809Author:Jay L. DevorePublisher:Cengage LearningStatistics for The Behavioral Sciences (MindTap C...StatisticsISBN:9781305504912Author:Frederick J Gravetter, Larry B. WallnauPublisher:Cengage Learning
- Elementary Statistics: Picturing the World (7th E...StatisticsISBN:9780134683416Author:Ron Larson, Betsy FarberPublisher:PEARSONThe Basic Practice of StatisticsStatisticsISBN:9781319042578Author:David S. Moore, William I. Notz, Michael A. FlignerPublisher:W. H. FreemanIntroduction to the Practice of StatisticsStatisticsISBN:9781319013387Author:David S. Moore, George P. McCabe, Bruce A. CraigPublisher:W. H. Freeman

MATLAB: An Introduction with Applications
Statistics
ISBN:9781119256830
Author:Amos Gilat
Publisher:John Wiley & Sons Inc

Probability and Statistics for Engineering and th...
Statistics
ISBN:9781305251809
Author:Jay L. Devore
Publisher:Cengage Learning

Statistics for The Behavioral Sciences (MindTap C...
Statistics
ISBN:9781305504912
Author:Frederick J Gravetter, Larry B. Wallnau
Publisher:Cengage Learning

Elementary Statistics: Picturing the World (7th E...
Statistics
ISBN:9780134683416
Author:Ron Larson, Betsy Farber
Publisher:PEARSON

The Basic Practice of Statistics
Statistics
ISBN:9781319042578
Author:David S. Moore, William I. Notz, Michael A. Fligner
Publisher:W. H. Freeman

Introduction to the Practice of Statistics
Statistics
ISBN:9781319013387
Author:David S. Moore, George P. McCabe, Bruce A. Craig
Publisher:W. H. Freeman