The graph in Figure 7 plots a variable Y against a variable X for 33 OECD countries using 2007 data. Variable Y is an indicator of the level of government social expenditure (as a proportion of GDP). Variable X is the level of government tax revenue (also as a percentage of GDP). Figure 7 also shows the regression equation for the line of best fit and the value of R2 which measures the strength of
The graph in Figure 7 plots a variable Y against a variable X for 33 OECD countries using 2007 data. Variable Y is an indicator of the level of government social expenditure (as a proportion of GDP). Variable X is the level of government tax revenue (also as a percentage of GDP). Figure 7 also shows the regression equation for the line of best fit and the value of R2 which measures the strength of

Algebra & Trigonometry with Analytic Geometry
13th Edition
ISBN:9781133382119
Author:Swokowski
Publisher:Swokowski
Chapter7: Analytic Trigonometry
Section7.6: The Inverse Trigonometric Functions
Problem 93E

Related questions
Question
Transcribed Image Text:30
FRA
AUT
ITA BEL
SWE
DEU
"DEN
"CHE
25
GBR
FIN
HUN
"PRT ESP
GRC, LUX
NOR
JAP
POL
"CZE
NLD
SVN
AUS
USA
"NZL
CAN
ISL
ŠVK IRL
ISR
CHL
EST
10
KOR
МЕX
5
10
20
30
40
50
60
Total tax revenue (% of GDP)
Line of best fit: Y = -1.52 + 0.61 X
R? = 0.61
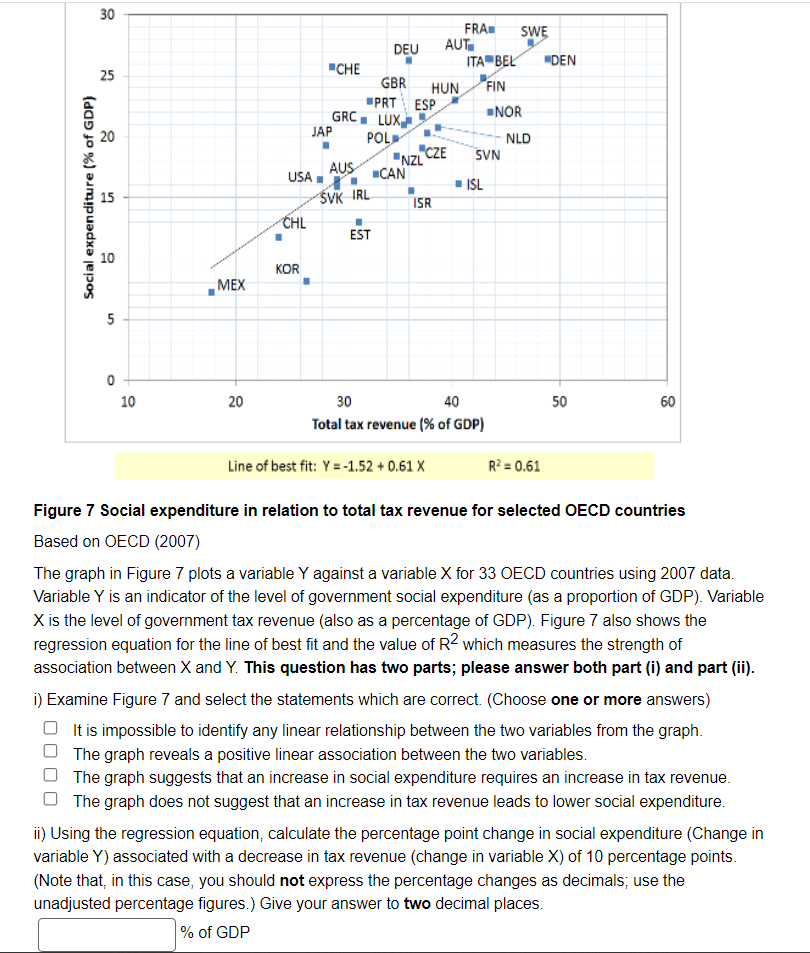
Figure 7 Social expenditure in relation to total tax revenue for selected OECD countries
Based on OECD (2007)
The graph in Figure 7 plots a variable Y against a variable X for 33 OECD countries using 2007 data.
Variable Y is an indicator of the level of government social expenditure (as a proportion of GDP). Variable
X is the level of government tax revenue (also as a percentage of GDP). Figure 7 also shows the
regression equation for the line of best fit and the value of R2 which measures the strength of
association between X and Y. This question has two parts; please answer both part (i) and part (ii).
i) Examine Figure 7 and select the statements which are correct. (Choose one or more answers)
It is impossible to identify any linear relationship between the two variables from the graph.
The graph reveals a positive linear association between the two variables.
The graph suggests that an increase in social expenditure requires an increase in tax revenue.
The graph does not suggest that an increase in tax revenue leads to lower social expenditure.
ii) Using the regression equation, calculate the percentage point change in social expenditure (Change in
variable Y) associated with a decrease in tax revenue (change in variable X) of 10 percentage points.
(Note that, in this case, you should not express the percentage changes as decimals; use the
unadjusted percentage figures.) Give your answer to two decimal places.
% of GDP
Social expenditure (% of GDP)
Expert Solution
This question has been solved!
Explore an expertly crafted, step-by-step solution for a thorough understanding of key concepts.

Step by step
Solved in 2 steps

Recommended textbooks for you
Algebra & Trigonometry with Analytic Geometry
Algebra
ISBN:
9781133382119
Author:
Swokowski
Publisher:
Cengage
Algebra & Trigonometry with Analytic Geometry
Algebra
ISBN:
9781133382119
Author:
Swokowski
Publisher:
Cengage