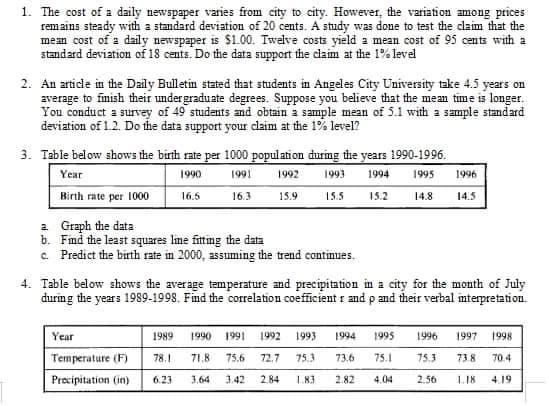
1. The cost of a daily newspaper varies from city to city. However, the variation among prices remains steady with a standard deviation of 20 cents. A study was done to test the claim that the mean cost of a daily newspaper is $1.00. Twelve costs yield a mean cost of 95 cents with a standard deviation of 18 cents. Do the data support the claim at the 1% level
1. The cost of a daily newspaper varies from city to city. However, the variation among prices remains steady with a standard deviation of 20 cents. A study was done to test the claim that the mean cost of a daily newspaper is $1.00. Twelve costs yield a mean cost of 95 cents with a standard deviation of 18 cents. Do the data support the claim at the 1% level

MATLAB: An Introduction with Applications
6th Edition
ISBN:9781119256830
Author:Amos Gilat
Publisher:Amos Gilat
Chapter1: Starting With Matlab
Section: Chapter Questions
Problem 1P

Related questions
Question
#1 With complete answer, solution and table
Transcribed Image Text:1. The cost of a daily newapaper varies from city to city. However, the variation among prices
remains steady with a standard deviation of 20 cents. A study was done to test the claim that the
mean cost of a daily newspaper is $1.00. Twelve costs yield a mean cost of 95 cents with a
standard deviation of 18 cents. Do the data support the dlaim at the 1% level
2. An artide in the Daily Bulletin stated that students in Angeles City University take 4.5 years on
average to finish their undergraduate degrees. Suppose you believe that the mean time is longer.
You conduct a survey of 49 students and obtain a sample mean of 5.1 with a sample standard
deviation of 1.2. Do the data support your claim at the 1% level?
3. Table below shows the birth rate per 1000 popul ation during the years 1990-1996.
Year
1990
1991
1992
1993
1994
1995
1996
Birth rate per 1000
16.5
16.3
15.9
15.5
15.2
14.8
14.5
a Graph the data
b. Fmd the least squares Ime fittimg the data
c. Predict the birth rate in 2000, assuming the trend continues.
4. Table below shows the average temperature and precipitation in a city for the month of July
during the years 1989-1998. Find the correlation coefficient r and p and their verbal mterpretation.
Year
1989
1990
1991
1992
1993
1994
1995
1996
1997
1998
Temperature (F)
78.1
71.8
75.6
72.7
75.3
73.6
75.1
75.3
738
70.4
Precipitation (in)
6.23
3.64
3.42
2.84
1.83
2.82
4.04
2.56
1.18
4.19
Expert Solution
This question has been solved!
Explore an expertly crafted, step-by-step solution for a thorough understanding of key concepts.

This is a popular solution!

Trending now
This is a popular solution!

Step by step
Solved in 4 steps with 4 images

Recommended textbooks for you
MATLAB: An Introduction with Applications
Statistics
ISBN:
9781119256830
Author:
Amos Gilat
Publisher:
John Wiley & Sons Inc

Probability and Statistics for Engineering and th…
Statistics
ISBN:
9781305251809
Author:
Jay L. Devore
Publisher:
Cengage Learning

Statistics for The Behavioral Sciences (MindTap C…
Statistics
ISBN:
9781305504912
Author:
Frederick J Gravetter, Larry B. Wallnau
Publisher:
Cengage Learning
MATLAB: An Introduction with Applications
Statistics
ISBN:
9781119256830
Author:
Amos Gilat
Publisher:
John Wiley & Sons Inc
Probability and Statistics for Engineering and th…
Statistics
ISBN:
9781305251809
Author:
Jay L. Devore
Publisher:
Cengage Learning
Statistics for The Behavioral Sciences (MindTap C…
Statistics
ISBN:
9781305504912
Author:
Frederick J Gravetter, Larry B. Wallnau
Publisher:
Cengage Learning

Elementary Statistics: Picturing the World (7th E…
Statistics
ISBN:
9780134683416
Author:
Ron Larson, Betsy Farber
Publisher:
PEARSON

The Basic Practice of Statistics
Statistics
ISBN:
9781319042578
Author:
David S. Moore, William I. Notz, Michael A. Fligner
Publisher:
W. H. Freeman

Introduction to the Practice of Statistics
Statistics
ISBN:
9781319013387
Author:
David S. Moore, George P. McCabe, Bruce A. Craig
Publisher:
W. H. Freeman