1. The population distribution requirement for this test is: O None since this is a Z-test O Need a normally distributed population since n, and n2 < 30 O Need a normally distributed population since this is a T-test O None since n, and n2 > 30 The hypotheses are: O Ho:p1 = p2; Ha:p1 + p2 O Ho:µ1 2 µ2; Ha:µ1 < µ2 O Ho:pi 2 pz; Ha:p1 < p2 O Ho:µ1 = µ2; Ha:µ1 # µ2 O Ho:P1 < Pz; Ha:p1 > P2 O Ho:H P2i Ha: > 2 2. This is a O twoO leftO right tailed test and the distribution used is OT since both o values are not known OZ since testing two proportions OZ since both o values are known
1. The population distribution requirement for this test is: O None since this is a Z-test O Need a normally distributed population since n, and n2 < 30 O Need a normally distributed population since this is a T-test O None since n, and n2 > 30 The hypotheses are: O Ho:p1 = p2; Ha:p1 + p2 O Ho:µ1 2 µ2; Ha:µ1 < µ2 O Ho:pi 2 pz; Ha:p1 < p2 O Ho:µ1 = µ2; Ha:µ1 # µ2 O Ho:P1 < Pz; Ha:p1 > P2 O Ho:H P2i Ha: > 2 2. This is a O twoO leftO right tailed test and the distribution used is OT since both o values are not known OZ since testing two proportions OZ since both o values are known

Linear Algebra: A Modern Introduction
4th Edition
ISBN:9781285463247
Author:David Poole
Publisher:David Poole
Chapter4: Eigenvalues And Eigenvectors
Section4.6: Applications And The Perron-frobenius Theorem
Problem 22EQ

Related questions
Question
Transcribed Image Text:HW 10.1,10.2
A Ideas for Literature Review
, Search Results
instructure.com/courses/2177802/assignments/13744575
A Maps
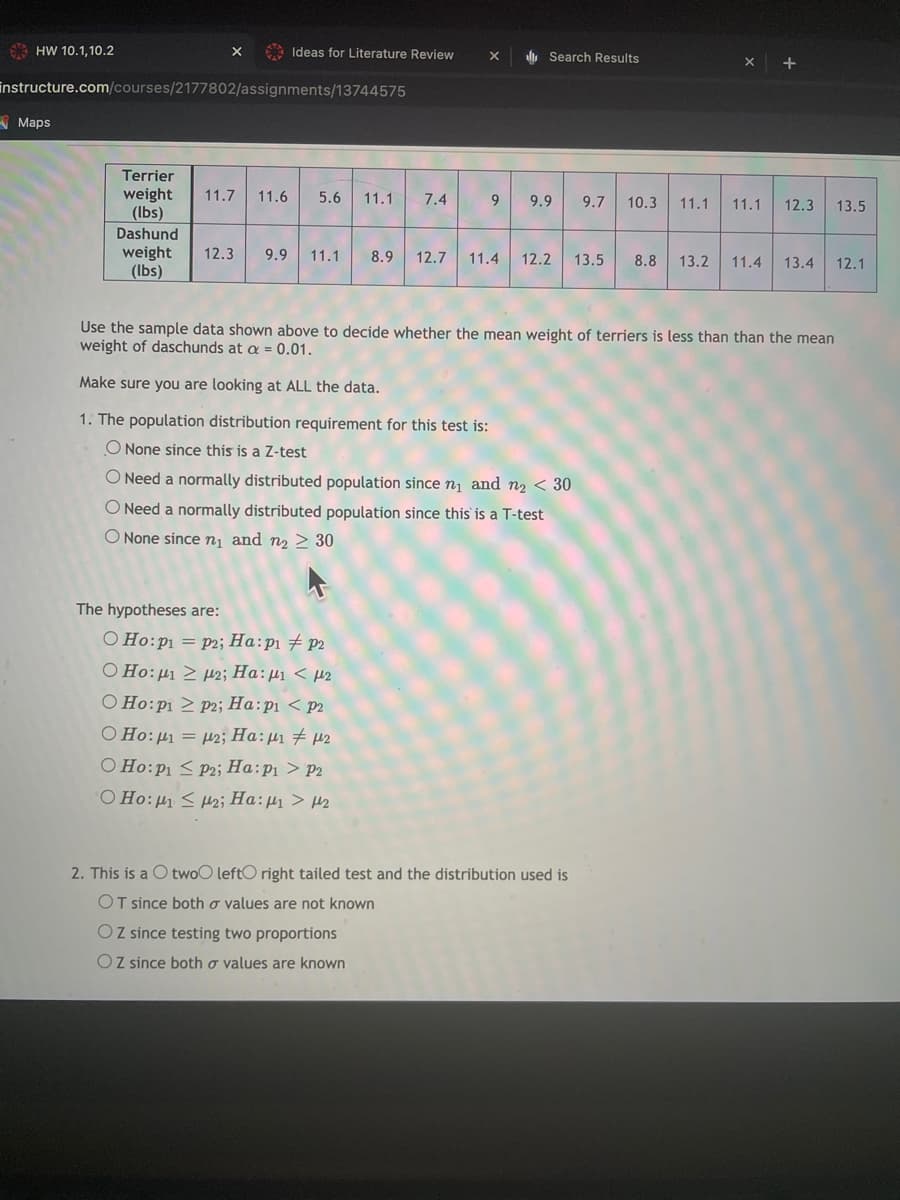
Terrier
weight
(lbs)
11.7
11.6
5.6
11.1
7.4
9.
9.9
9.7
10.3
11.1
11.1
12.3
13.5
Dashund
weight
(Ibs)
12.3
9.9
11.1
8.9
12.7
11.4
12.2
13.5
8.8
13.2
11.4
13.4
12.1
Use the sample data shown above to decide whether the mean weight of terriers is less than than the mean
weight of daschunds at a = 0.01.
Make sure you are looking at ALL the data.
1. The population distribution requirement for this test is:
O None since this is a Z-test
ONeed a normally distributed population since n, and n2 < 30
O Need a normally distributed population since this is a T-test
O None since n¡ and n2 > 30
The hypotheses are:
O Ho:p1 = p2; Ha:p1 # p2
O Ho:µ1 > µ2; Ha:µ1 < µ2
O Ho:p1 > p2; Ha:pi < p2
O Ho: µ1 = µ2; Ha:µ1 # µ2
O Ho:p1 < P2; Ha:p1 > P2
O Ho:µ1 < Hzi Ha:µ > µ2
2. This is a O twoO leftO right tailed test and the distribution used is
OT since both o values are not known
O Z since testing two proportions
OZ since both o values are known
Expert Solution
This question has been solved!
Explore an expertly crafted, step-by-step solution for a thorough understanding of key concepts.

Step by step
Solved in 3 steps

Knowledge Booster


Learn more about
Need a deep-dive on the concept behind this application? Look no further. Learn more about this topic, statistics and related others by exploring similar questions and additional content below.Recommended textbooks for you
Linear Algebra: A Modern Introduction
Algebra
ISBN:
9781285463247
Author:
David Poole
Publisher:
Cengage Learning

Glencoe Algebra 1, Student Edition, 9780079039897…
Algebra
ISBN:
9780079039897
Author:
Carter
Publisher:
McGraw Hill
Linear Algebra: A Modern Introduction
Algebra
ISBN:
9781285463247
Author:
David Poole
Publisher:
Cengage Learning
Glencoe Algebra 1, Student Edition, 9780079039897…
Algebra
ISBN:
9780079039897
Author:
Carter
Publisher:
McGraw Hill