1. The scores on the Wechsler Intelligence Scale for Children (WISC) are thought to be Normally distributed with standard deviation -10. A simple random sample of 25 children is taken, and cach is given the WISC. The mean of the 25 scores is - 104.32. Based on these data, what is a 95% confidence interval for A104.32 0.78 B)104.32 3.29 C104.32 + 3.92 D104.32 19.60 2. Ir in the study of the lifetime of 60-watt light bulbs it was desired to have a margin of error no larger than 6 hours with 99% confidence, how many randomly selected 60-watt light bulbs should be tested to achieve this result? A13 B)97 C)165 D42 ENot within +2 of any of the above. 3. A test of significance was conducted in a study involving a random sample of 25 subjects. Based on the test result using the sample mean, , it was determined that the P-value was equal to 0.028. Which of the following statements about this P-value is TRUE? Ain this situation there is no evidence against the null hypothesis. B The P-value was calculated under the assumption that the null hypothesis was true. CThe probability of a value of the test statistic at least as extreme as that observed in this study, assuming the altemative hypothesis is true, is 0.028. DAll of the above are true statements. EOnly C is a true statement about the P-value. 4. You wish to compare the prices of apartments in two neighboring towns. You take a simple random sample of 15 apartments in town A and calculate the average price of these apartments. You repeat this for 12 apartments in town B. Let represent the true average price of apartments in town A and , the average price in town B. What would be the hypotheses for this problem? AH -0, versus H: D<0. BH: 0-0, versus H: 0,> 0 H: 0-0, versus H: D#D 5. Independent random samples were obtained from two Normally distributed populations. The study was conducted in order to test the null hypothesis Ho: i -o against the altenative Ha: "i >o; The following is a summary of the sample results: from Population Ifrom Population 2 Sample size Sample Mean Sample Standard Deviation 21 16 284.4 261.5 25.4 15.1 To test this hypothesis the value of the test statistic and the P-value are, respectively A3,41, greater than 0.1. B1.68, between 0.02 and 0.05. C3.41, between 0.001 and 0.0025. D2.83, between .01 and .025. E)2.83, greater than 0.05.
1. The scores on the Wechsler Intelligence Scale for Children (WISC) are thought to be Normally distributed with standard deviation -10. A simple random sample of 25 children is taken, and cach is given the WISC. The mean of the 25 scores is - 104.32. Based on these data, what is a 95% confidence interval for A104.32 0.78 B)104.32 3.29 C104.32 + 3.92 D104.32 19.60 2. Ir in the study of the lifetime of 60-watt light bulbs it was desired to have a margin of error no larger than 6 hours with 99% confidence, how many randomly selected 60-watt light bulbs should be tested to achieve this result? A13 B)97 C)165 D42 ENot within +2 of any of the above. 3. A test of significance was conducted in a study involving a random sample of 25 subjects. Based on the test result using the sample mean, , it was determined that the P-value was equal to 0.028. Which of the following statements about this P-value is TRUE? Ain this situation there is no evidence against the null hypothesis. B The P-value was calculated under the assumption that the null hypothesis was true. CThe probability of a value of the test statistic at least as extreme as that observed in this study, assuming the altemative hypothesis is true, is 0.028. DAll of the above are true statements. EOnly C is a true statement about the P-value. 4. You wish to compare the prices of apartments in two neighboring towns. You take a simple random sample of 15 apartments in town A and calculate the average price of these apartments. You repeat this for 12 apartments in town B. Let represent the true average price of apartments in town A and , the average price in town B. What would be the hypotheses for this problem? AH -0, versus H: D<0. BH: 0-0, versus H: 0,> 0 H: 0-0, versus H: D#D 5. Independent random samples were obtained from two Normally distributed populations. The study was conducted in order to test the null hypothesis Ho: i -o against the altenative Ha: "i >o; The following is a summary of the sample results: from Population Ifrom Population 2 Sample size Sample Mean Sample Standard Deviation 21 16 284.4 261.5 25.4 15.1 To test this hypothesis the value of the test statistic and the P-value are, respectively A3,41, greater than 0.1. B1.68, between 0.02 and 0.05. C3.41, between 0.001 and 0.0025. D2.83, between .01 and .025. E)2.83, greater than 0.05.

MATLAB: An Introduction with Applications
6th Edition
ISBN:9781119256830
Author:Amos Gilat
Publisher:Amos Gilat
Chapter1: Starting With Matlab
Section: Chapter Questions
Problem 1P

Related questions

Topic Video
Question
Hi I know that you can’t answer every question is there anyway you can just answer question 3 please?
Transcribed Image Text:3:03
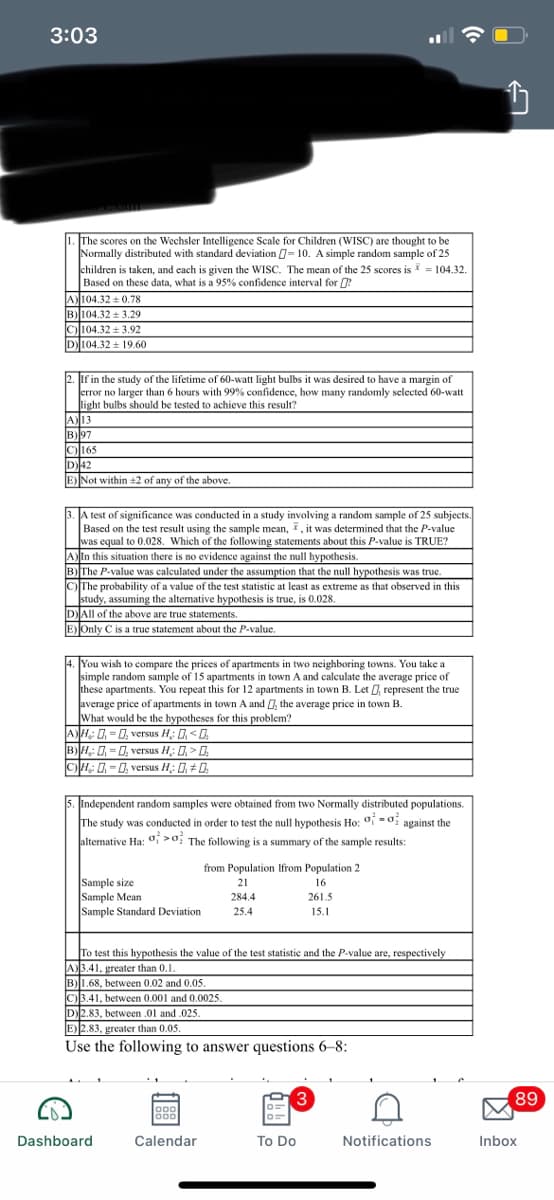
The scores on the Wechsler Intelligence Scale for Children (WISC) are thought to be
Normally distributed with standard deviation = 10. A simple random sample of 25
children is taken, and each is given the WISC. The mean of the 25 scores is = 104.32.
Based on these data, what is a 95% confidence interval for
A104.32 0.78
B104.32 3. 29
o104.32 + 3.92
D104.32 + 19.60
2. If in the study of the lifetime of 60-watt light bulbs it was desired to have a margin of
error no larger than 6 hours with 99% confidence, how many randomly selected 60-watt
light bulbs should be tested to achieve this result?
A13
B)97
C)165
D42
Not within +2 of any of the above.
A test of significance was conducted in a study involving a random sample of 25 subjects.
Based on the test result using the sample mean, I , it was determined that the P-value
was equal to 0.028. Which of the following statements about this P-value is TRUE?
AIn this situation there is no evidence against the null hypothesis.
B)The P-value was calculated under the assumption that the null hypothesis was true.
cThe probability of a value of the test statistic at least as extreme as that observed in this
study, assuming the altemative hypothesis is true, is 0.028.
DAll of the above are true statements.
E) Only C is a true statement about the P.value.
You wish to compare the prices of apartments in two neighboring towns. You take a
simple random sample of 15 apartments in town A and calculate the average price of
these apartments. You repeat this for 12 apartments in town B. Let represent the true
average price of apartments in town A and the average price in town B.
What would be the hypotheses for this problem?
AH: 0=0, versus H: 0,< 0
B)H: 0 = 0, versus H: 0,> 0.
H:0-0, versus H: 0#0
5. Independent random samples were obtained from two Normally distributed populations.
The study was conducted in order to test the null hypothesis Ho: i =0i against the
altemative Ha: o; >0; The following is a summary of the sample results:
from Population Ifrom Population 2
Sample size
Sample Mean
Sample Standard Deviation
21
16
284.4
261.5
25.4
15.1
To test this hypothesis the value of the test statistic and the P-value are, respectively
A)3.41. greater than 0.1.
B)1.68, between 0.02 and 0.05.
C)3.41, between 0.001 and 0.0025.
D2.83, between .01 and .025.
E) 2.83, greater than 0.05.
Use the following to answer questions 6–8:
89
o00
000
Dashboard
Calendar
To Do
Notifications
Inbox
Expert Solution
This question has been solved!
Explore an expertly crafted, step-by-step solution for a thorough understanding of key concepts.

This is a popular solution!

Trending now
This is a popular solution!

Step by step
Solved in 2 steps with 2 images

Knowledge Booster


Learn more about
Need a deep-dive on the concept behind this application? Look no further. Learn more about this topic, statistics and related others by exploring similar questions and additional content below.Recommended textbooks for you
MATLAB: An Introduction with Applications
Statistics
ISBN:
9781119256830
Author:
Amos Gilat
Publisher:
John Wiley & Sons Inc

Probability and Statistics for Engineering and th…
Statistics
ISBN:
9781305251809
Author:
Jay L. Devore
Publisher:
Cengage Learning

Statistics for The Behavioral Sciences (MindTap C…
Statistics
ISBN:
9781305504912
Author:
Frederick J Gravetter, Larry B. Wallnau
Publisher:
Cengage Learning
MATLAB: An Introduction with Applications
Statistics
ISBN:
9781119256830
Author:
Amos Gilat
Publisher:
John Wiley & Sons Inc
Probability and Statistics for Engineering and th…
Statistics
ISBN:
9781305251809
Author:
Jay L. Devore
Publisher:
Cengage Learning
Statistics for The Behavioral Sciences (MindTap C…
Statistics
ISBN:
9781305504912
Author:
Frederick J Gravetter, Larry B. Wallnau
Publisher:
Cengage Learning

Elementary Statistics: Picturing the World (7th E…
Statistics
ISBN:
9780134683416
Author:
Ron Larson, Betsy Farber
Publisher:
PEARSON

The Basic Practice of Statistics
Statistics
ISBN:
9781319042578
Author:
David S. Moore, William I. Notz, Michael A. Fligner
Publisher:
W. H. Freeman

Introduction to the Practice of Statistics
Statistics
ISBN:
9781319013387
Author:
David S. Moore, George P. McCabe, Bruce A. Craig
Publisher:
W. H. Freeman