3. The average daily volume of a computer stock in 2011 was µ = 35.1 million shares, according to a reliable source. A stock analyst believes that the stock volume in 2014 is different from the 2011 level. Based on a random sample of 30 trading days in 2014, he finds the sample mean to be 29.1 million shares, with a standard deviation of s = 11.1 million shares. Test the hypotheses by constructing a 95% confidence interval. Complete parts (a) through (c) below. (a) State the hypotheses for the test. Но: (1) (2) 35.1 million shares H1: (3) (4) 35.1 million shares (b) Construct a 95% confidence interval about the sample mean of stocks traded in 2014. The lower bound is million shares. The upper bound is million shares. (Round to three decimal places as needed.) (c) Will the researcher reject the null hypothesis? A. Reject the null hypothesis because u = 35.1 million shares falls in the confidence interval. B. Do not reject the null hypothesis because u= 35.1 million shares does not fall in the confidence interval. OC. Do not reject the null hypothesis because u= 35.1 million shares falls in the confidence interval. D. Reject the null hypothesis because u = 35.1 million shares does not fall in the confidence interval. (1) O o (2) (3) (4) > %3D 0000 000 O00 O O O OO
3. The average daily volume of a computer stock in 2011 was µ = 35.1 million shares, according to a reliable source. A stock analyst believes that the stock volume in 2014 is different from the 2011 level. Based on a random sample of 30 trading days in 2014, he finds the sample mean to be 29.1 million shares, with a standard deviation of s = 11.1 million shares. Test the hypotheses by constructing a 95% confidence interval. Complete parts (a) through (c) below. (a) State the hypotheses for the test. Но: (1) (2) 35.1 million shares H1: (3) (4) 35.1 million shares (b) Construct a 95% confidence interval about the sample mean of stocks traded in 2014. The lower bound is million shares. The upper bound is million shares. (Round to three decimal places as needed.) (c) Will the researcher reject the null hypothesis? A. Reject the null hypothesis because u = 35.1 million shares falls in the confidence interval. B. Do not reject the null hypothesis because u= 35.1 million shares does not fall in the confidence interval. OC. Do not reject the null hypothesis because u= 35.1 million shares falls in the confidence interval. D. Reject the null hypothesis because u = 35.1 million shares does not fall in the confidence interval. (1) O o (2) (3) (4) > %3D 0000 000 O00 O O O OO

MATLAB: An Introduction with Applications
6th Edition
ISBN:9781119256830
Author:Amos Gilat
Publisher:Amos Gilat
Chapter1: Starting With Matlab
Section: Chapter Questions
Problem 1P

Related questions
Question
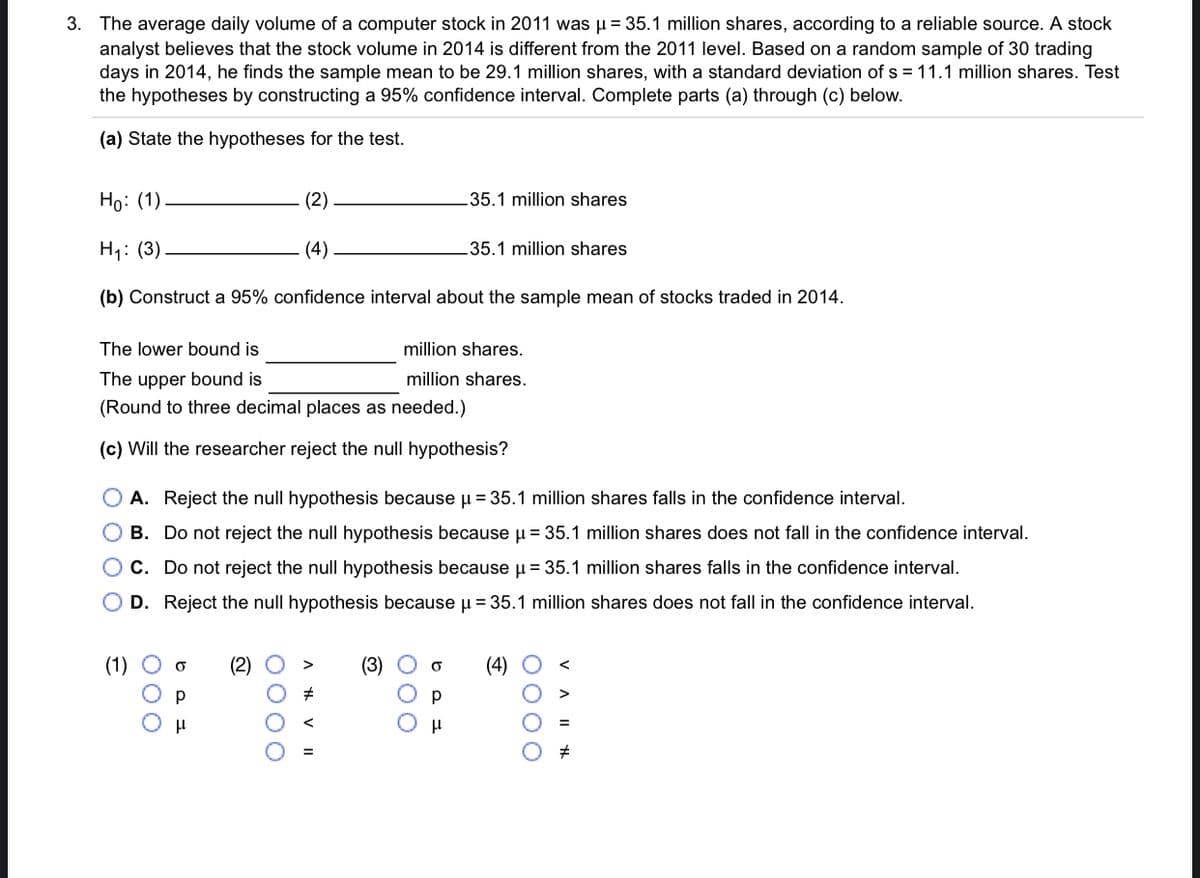
Transcribed Image Text:3. The average daily volume of a computer stock in 2011 was µ = 35.1 million shares, according to a reliable source. A stock
analyst believes that the stock volume in 2014 is different from the 2011 level. Based on a random sample of 30 trading
days in 2014, he finds the sample mean
the hypotheses by constructing a 95% confidence interval. Complete parts (a) through (c) below.
be 29.1 million shares, with a standard deviation of s = 11.1 million shares. Test
(a) State the hypotheses for the test.
Но: (1)
(2)
35.1 million shares
H1: (3)
(4)
35.1 million shares
(b) Construct a 95% confidence interval about the sample mean of stocks traded in 2014.
The lower bound is
million shares.
The upper bound is
million shares.
(Round to three decimal places as needed.)
(c) Will the researcher reject the null hypothesis?
A. Reject the null hypothesis because u = 35.1 million shares falls in the confidence interval.
O B. Do not reject the null hypothesis because u = 35.1 million shares does not fall in the confidence interval.
OC. Do not reject the null hypothesis because µ = 35.1 million shares falls in the confidence interval.
D. Reject the null hypothesis because u = 35.1 million shares does not fall in the confidence interval.
(1)
(2)
(3)
(4)
O000
000
000
O 0 0 O
Expert Solution
This question has been solved!
Explore an expertly crafted, step-by-step solution for a thorough understanding of key concepts.

This is a popular solution!

Trending now
This is a popular solution!

Step by step
Solved in 2 steps

Recommended textbooks for you
MATLAB: An Introduction with Applications
Statistics
ISBN:
9781119256830
Author:
Amos Gilat
Publisher:
John Wiley & Sons Inc

Probability and Statistics for Engineering and th…
Statistics
ISBN:
9781305251809
Author:
Jay L. Devore
Publisher:
Cengage Learning

Statistics for The Behavioral Sciences (MindTap C…
Statistics
ISBN:
9781305504912
Author:
Frederick J Gravetter, Larry B. Wallnau
Publisher:
Cengage Learning
MATLAB: An Introduction with Applications
Statistics
ISBN:
9781119256830
Author:
Amos Gilat
Publisher:
John Wiley & Sons Inc
Probability and Statistics for Engineering and th…
Statistics
ISBN:
9781305251809
Author:
Jay L. Devore
Publisher:
Cengage Learning
Statistics for The Behavioral Sciences (MindTap C…
Statistics
ISBN:
9781305504912
Author:
Frederick J Gravetter, Larry B. Wallnau
Publisher:
Cengage Learning

Elementary Statistics: Picturing the World (7th E…
Statistics
ISBN:
9780134683416
Author:
Ron Larson, Betsy Farber
Publisher:
PEARSON

The Basic Practice of Statistics
Statistics
ISBN:
9781319042578
Author:
David S. Moore, William I. Notz, Michael A. Fligner
Publisher:
W. H. Freeman

Introduction to the Practice of Statistics
Statistics
ISBN:
9781319013387
Author:
David S. Moore, George P. McCabe, Bruce A. Craig
Publisher:
W. H. Freeman