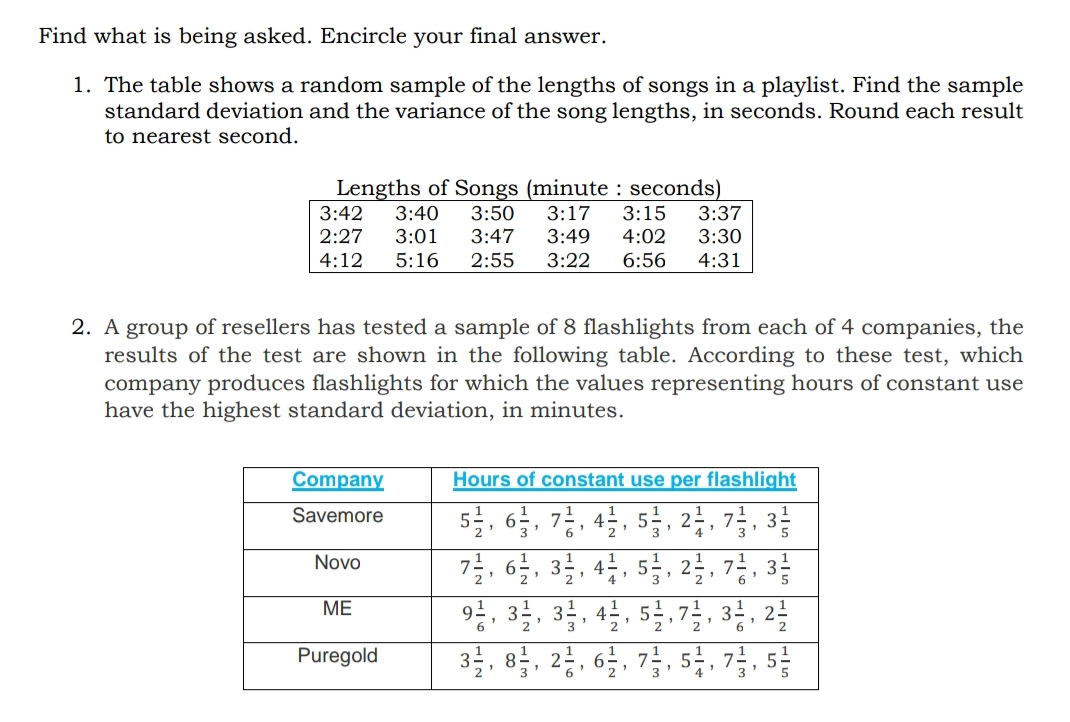
1. The table shows a random sample of the lengths of songs in a playlist. Find the sample standard deviation and the variance of the song lengths, in seconds. Round each result to nearest second. Lengths of Songs (minute : seconds) 3:42 2:27 3:40 3:01 5:16 3:50 3:17 3:15 3:37 3:47 3:49 3:22 4:02 3:30 4:31 4:12 2:55 6:56 2. A group of resellers has tested a sample of 8 flashlights from each of 4 companies, the results of the test are shown in the following table. According to these test, which company produces flashlights for which the values representing hours of constant use have the highest standard deviation, in minutes.


Inverse Normal Distribution
The method used for finding the corresponding z-critical value in a normal distribution using the known probability is said to be an inverse normal distribution. The inverse normal distribution is a continuous probability distribution with a family of two parameters.
Mean, Median, Mode
It is a descriptive summary of a data set. It can be defined by using some of the measures. The central tendencies do not provide information regarding individual data from the dataset. However, they give a summary of the data set. The central tendency or measure of central tendency is a central or typical value for a probability distribution.
Z-Scores
A z-score is a unit of measurement used in statistics to describe the position of a raw score in terms of its distance from the mean, measured with reference to standard deviation from the mean. Z-scores are useful in statistics because they allow comparison between two scores that belong to different normal distributions.


Trending now
This is a popular solution!

Step by step
Solved in 4 steps


