Find the range, variance, and standard deviation for the given sample data, if possible. If the measures of variation can be obtained for these values, do the results make sense? Biologists conducted experiments to determine whether a deficiency of carbon dioxide in the soil affects the phenotypes of peas. Listed below are the phenotype codes, where 1=smooth-yellow, 2=smooth-green, 3 = wrinkled yellow, and 4 = wrinkled-green. 2 22 2 42 32 2 2 2 2 12 2 3 12 2 2O Can the range of the sample data be obtained for these values? Choose the correct answer below and, if necessary, fill in the answer box within your choice. O A. The range of the sample data is (Type an integer or a decimal. Do not round.) O B. The range of the sample data cannot be calculated.
Find the range, variance, and standard deviation for the given sample data, if possible. If the measures of variation can be obtained for these values, do the results make sense? Biologists conducted experiments to determine whether a deficiency of carbon dioxide in the soil affects the phenotypes of peas. Listed below are the phenotype codes, where 1=smooth-yellow, 2=smooth-green, 3 = wrinkled yellow, and 4 = wrinkled-green. 2 22 2 42 32 2 2 2 2 12 2 3 12 2 2O Can the range of the sample data be obtained for these values? Choose the correct answer below and, if necessary, fill in the answer box within your choice. O A. The range of the sample data is (Type an integer or a decimal. Do not round.) O B. The range of the sample data cannot be calculated.

Glencoe Algebra 1, Student Edition, 9780079039897, 0079039898, 2018
18th Edition
ISBN:9780079039897
Author:Carter
Publisher:Carter
Chapter10: Statistics
Section10.4: Distributions Of Data
Problem 19PFA

Related questions
Question
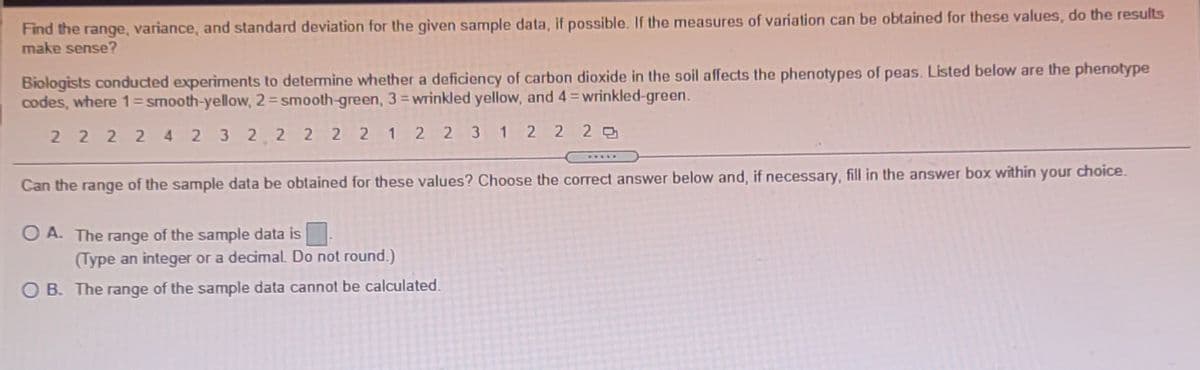
Transcribed Image Text:Find the range, variance, and standard deviation for the given sample data, if possible. If the measures of variation can be obtained for these values, do the results
make sense?
Biologists conducted experiments to detemine whether a deficiency of carbon dioxide in the soil affects the phenotypes of peas. Listed below are the phenotype
codes, where 1=smooth-yellow, 2=smooth-green, 3=wrinkled yellow, and 4=wrinkled-green.
2 2 2 2 4 2 3 2 2 2 2 2 1 2 2 3
1 2 2 2
.....
Can the range of the sample data be obtained for these values? Choose the correct answer below and, if necessary, fill in the answer box within your choice.
O A. The range of the sample data is
(Type an integer or a decimal. Do not round.)
B. The range of the sample data cannot be calculated.
Expert Solution
This question has been solved!
Explore an expertly crafted, step-by-step solution for a thorough understanding of key concepts.

This is a popular solution!

Trending now
This is a popular solution!

Step by step
Solved in 2 steps with 1 images

Recommended textbooks for you
Glencoe Algebra 1, Student Edition, 9780079039897…
Algebra
ISBN:
9780079039897
Author:
Carter
Publisher:
McGraw Hill
Glencoe Algebra 1, Student Edition, 9780079039897…
Algebra
ISBN:
9780079039897
Author:
Carter
Publisher:
McGraw Hill