1. The table shows the minimum wage rates for the United States during different years. Year 1978 1979 1980 1990 1991 1996 1997 2007 2008 2009 Minimum hourly wage ($) 2.65 2.90 3.35 3.80 4.25 4.75 5.15 5.85 6.55 7.25 (a) Write the least squares regression equation that models the data. Let x = time in years since 1900 and let y = minimum hourly wage. (b) Use the equation to estimate the minimum hourly wage of a U.S. worker in 2025. Show your work. Answer:
1. The table shows the minimum wage rates for the United States during different years. Year 1978 1979 1980 1990 1991 1996 1997 2007 2008 2009 Minimum hourly wage ($) 2.65 2.90 3.35 3.80 4.25 4.75 5.15 5.85 6.55 7.25 (a) Write the least squares regression equation that models the data. Let x = time in years since 1900 and let y = minimum hourly wage. (b) Use the equation to estimate the minimum hourly wage of a U.S. worker in 2025. Show your work. Answer:

Linear Algebra: A Modern Introduction
4th Edition
ISBN:9781285463247
Author:David Poole
Publisher:David Poole
Chapter7: Distance And Approximation
Section7.3: Least Squares Approximation
Problem 33EQ

Related questions
Question
Transcribed Image Text:1.
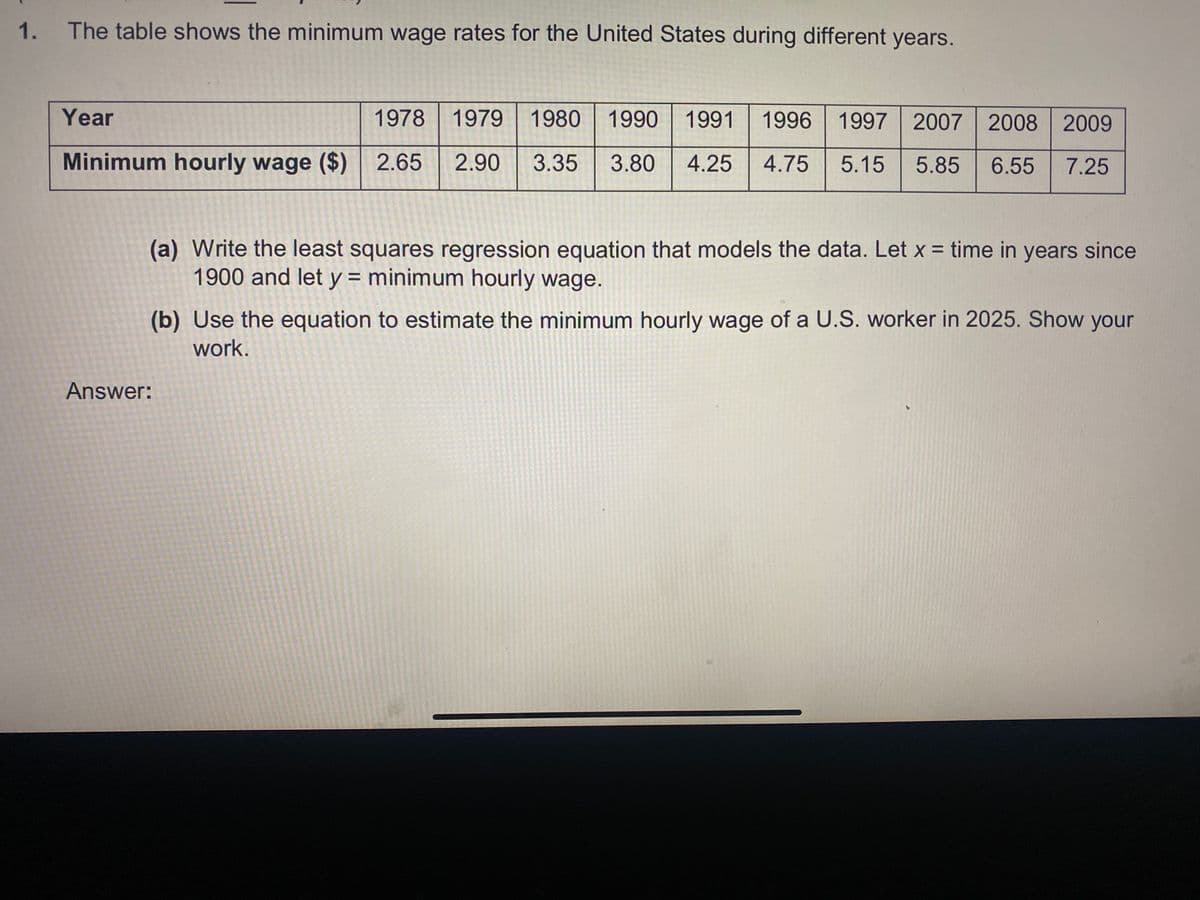
The table shows the minimum wage rates for the United States during different years.
Year
1978 1979
1980 1990 1991
1996 1997 2007 2008 2009
Minimum hourly wage ($) 2.65
2.90
3.35
3.80
4.25
4.75
5.15
5.85
6.55
7.25
(a) Write the least squares regression equation that models the data. Let x = time in years since
1900 and let y = minimum hourly wage.
%3D
(b) Use the equation to estimate the minimum hourly wage of a U.S. worker in 2025. Show your
work.
Answer:
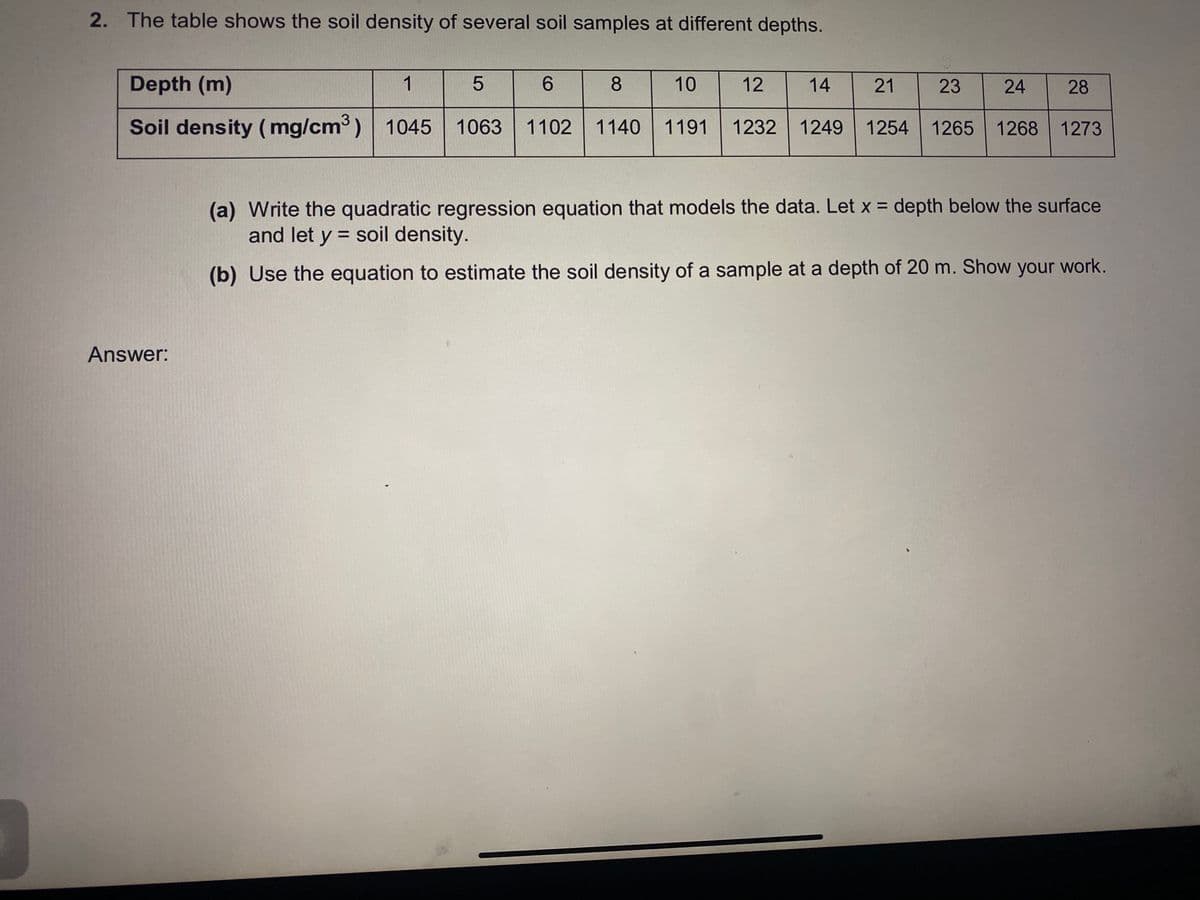
Transcribed Image Text:2. The table shows the soil density of several soil samples at different depths.
Depth (m)
1
6.
8.
10
12
14
21
23
24
28
Soil density (mg/cm3) 1045 1063
1102 1140 1191
1232 1249
1254 1265
1268 1273
(a) Write the quadratic regression equation that models the data. Let x = depth below the surface
and let y = soil density.
(b) Use the equation to estimate the soil density of a sample at a depth of 20 m. Show your work.
Answer:
Expert Solution
This question has been solved!
Explore an expertly crafted, step-by-step solution for a thorough understanding of key concepts.

This is a popular solution!

Trending now
This is a popular solution!

Step by step
Solved in 3 steps with 9 images

Recommended textbooks for you
Linear Algebra: A Modern Introduction
Algebra
ISBN:
9781285463247
Author:
David Poole
Publisher:
Cengage Learning

Elementary Linear Algebra (MindTap Course List)
Algebra
ISBN:
9781305658004
Author:
Ron Larson
Publisher:
Cengage Learning

Functions and Change: A Modeling Approach to Coll…
Algebra
ISBN:
9781337111348
Author:
Bruce Crauder, Benny Evans, Alan Noell
Publisher:
Cengage Learning
Linear Algebra: A Modern Introduction
Algebra
ISBN:
9781285463247
Author:
David Poole
Publisher:
Cengage Learning
Elementary Linear Algebra (MindTap Course List)
Algebra
ISBN:
9781305658004
Author:
Ron Larson
Publisher:
Cengage Learning
Functions and Change: A Modeling Approach to Coll…
Algebra
ISBN:
9781337111348
Author:
Bruce Crauder, Benny Evans, Alan Noell
Publisher:
Cengage Learning

College Algebra
Algebra
ISBN:
9781305115545
Author:
James Stewart, Lothar Redlin, Saleem Watson
Publisher:
Cengage Learning