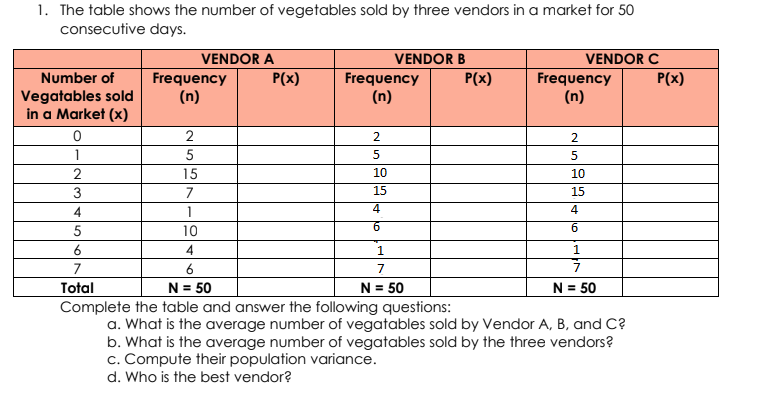
1. The table shows the number of vegetables sold by three vendors in a market for 50 consecutive days. VENDOR A P(x) VENDOR B Frequency P(x) VENDOR C Number of P(x) Frequency (n) Frequency (n) Vegatables sold in a Market (x) (n) 2 2 15 10 10 3 7 15 15 4 1 4 4 10 6.
1. The table shows the number of vegetables sold by three vendors in a market for 50 consecutive days. VENDOR A P(x) VENDOR B Frequency P(x) VENDOR C Number of P(x) Frequency (n) Frequency (n) Vegatables sold in a Market (x) (n) 2 2 15 10 10 3 7 15 15 4 1 4 4 10 6.

Algebra & Trigonometry with Analytic Geometry
13th Edition
ISBN:9781133382119
Author:Swokowski
Publisher:Swokowski
Chapter10: Sequences, Series, And Probability
Section10.8: Probability
Problem 31E

Related questions
Question
SHOW COMPLETE SOLUTION. THANK YOU
Transcribed Image Text:1. The table shows the number of vegetables sold by three vendors in a market for 50
consecutive days.
VENDOR A
VENDOR B
VENDOR C
Number of
Frequency
(n)
P(x)
P(x)
Frequency
(n)
P(x)
Frequency
(n)
Vegatables sold
in a Market (x)
2
2.
2.
1
5
2
15
10
10
3
7
15
15
4
1
4
4
5
10
6.
6.
4
1.
1.
7
6
7
7
Total
N = 50
N = 50
N = 50
Complete the table and answer the following questions:
a. What is the average number of vegatables sold by Vendor A, B, and C?
b. What is the average number of vegatables sold by the three vendors?
c. Compute their population variance.
d. Who is the best vendor?
Expert Solution
This question has been solved!
Explore an expertly crafted, step-by-step solution for a thorough understanding of key concepts.

Step by step
Solved in 2 steps

Knowledge Booster


Learn more about
Need a deep-dive on the concept behind this application? Look no further. Learn more about this topic, statistics and related others by exploring similar questions and additional content below.Recommended textbooks for you
Algebra & Trigonometry with Analytic Geometry
Algebra
ISBN:
9781133382119
Author:
Swokowski
Publisher:
Cengage
Algebra & Trigonometry with Analytic Geometry
Algebra
ISBN:
9781133382119
Author:
Swokowski
Publisher:
Cengage