1. This question will use Excel to select random samples of varying sizes from a uniform distribution on the interval 1 to 10. The goal is to demonstrate the effect of sample size on the shape of the sampling distribution of the mean. (a) Open the Excel and go to the DATA tab. (b) Select Data Analysis on the ribbon. If Data Analysis is not available on the ribbon you must install the Analysis Toolpak add-in (see Sakai-Resources-Excel). * Load the Data Analysis ToolPak: Click the File tab, and then click Options. Select Add-Ins on the left, click Analysis ToolPak in the list on the right, and then in the Manage box, select Excel Add-ins. Click Go. Select Analysis ToolPak and click Ok. (c) You should now see the Data Analysis dialog box Select Random Number Generation and click OK. * for Number of Variables enter 2 * for Number of Random Numbers enter 50 * for Distribution select Uniform * for Parameters enter Between 1 and 10 * for Output options Select New Worksheet Ply * You will see 50 rows and the random samples drawn from the uniform distribution on 1-10. In this case this means that there are 50 samples each of size 2. In the first cell of the empty column (cell C1 for this case) enter a formula to find the mean of your sample in the first row. Drag the formula down to the end of the data, i.e. to row 50. The 50 means in column C1 become out first sample of means. columns of numbers. The rows will be considered as (d) Copy your means to a new worksheet. Use Excel to calculate the mean and standard deviation of this sample. Create a histogram of the distribution of the sample of means. For the histogram use boundaries 1, 2, 3 ...10. Refer to Assignment 1 for directions on histograms (e) Repeat Steps (c) and (d) three more times
1. This question will use Excel to select random samples of varying sizes from a uniform distribution on the interval 1 to 10. The goal is to demonstrate the effect of sample size on the shape of the sampling distribution of the mean. (a) Open the Excel and go to the DATA tab. (b) Select Data Analysis on the ribbon. If Data Analysis is not available on the ribbon you must install the Analysis Toolpak add-in (see Sakai-Resources-Excel). * Load the Data Analysis ToolPak: Click the File tab, and then click Options. Select Add-Ins on the left, click Analysis ToolPak in the list on the right, and then in the Manage box, select Excel Add-ins. Click Go. Select Analysis ToolPak and click Ok. (c) You should now see the Data Analysis dialog box Select Random Number Generation and click OK. * for Number of Variables enter 2 * for Number of Random Numbers enter 50 * for Distribution select Uniform * for Parameters enter Between 1 and 10 * for Output options Select New Worksheet Ply * You will see 50 rows and the random samples drawn from the uniform distribution on 1-10. In this case this means that there are 50 samples each of size 2. In the first cell of the empty column (cell C1 for this case) enter a formula to find the mean of your sample in the first row. Drag the formula down to the end of the data, i.e. to row 50. The 50 means in column C1 become out first sample of means. columns of numbers. The rows will be considered as (d) Copy your means to a new worksheet. Use Excel to calculate the mean and standard deviation of this sample. Create a histogram of the distribution of the sample of means. For the histogram use boundaries 1, 2, 3 ...10. Refer to Assignment 1 for directions on histograms (e) Repeat Steps (c) and (d) three more times

Glencoe Algebra 1, Student Edition, 9780079039897, 0079039898, 2018
18th Edition
ISBN:9780079039897
Author:Carter
Publisher:Carter
Chapter10: Statistics
Section10.4: Distributions Of Data
Problem 19PFA

Related questions
Question
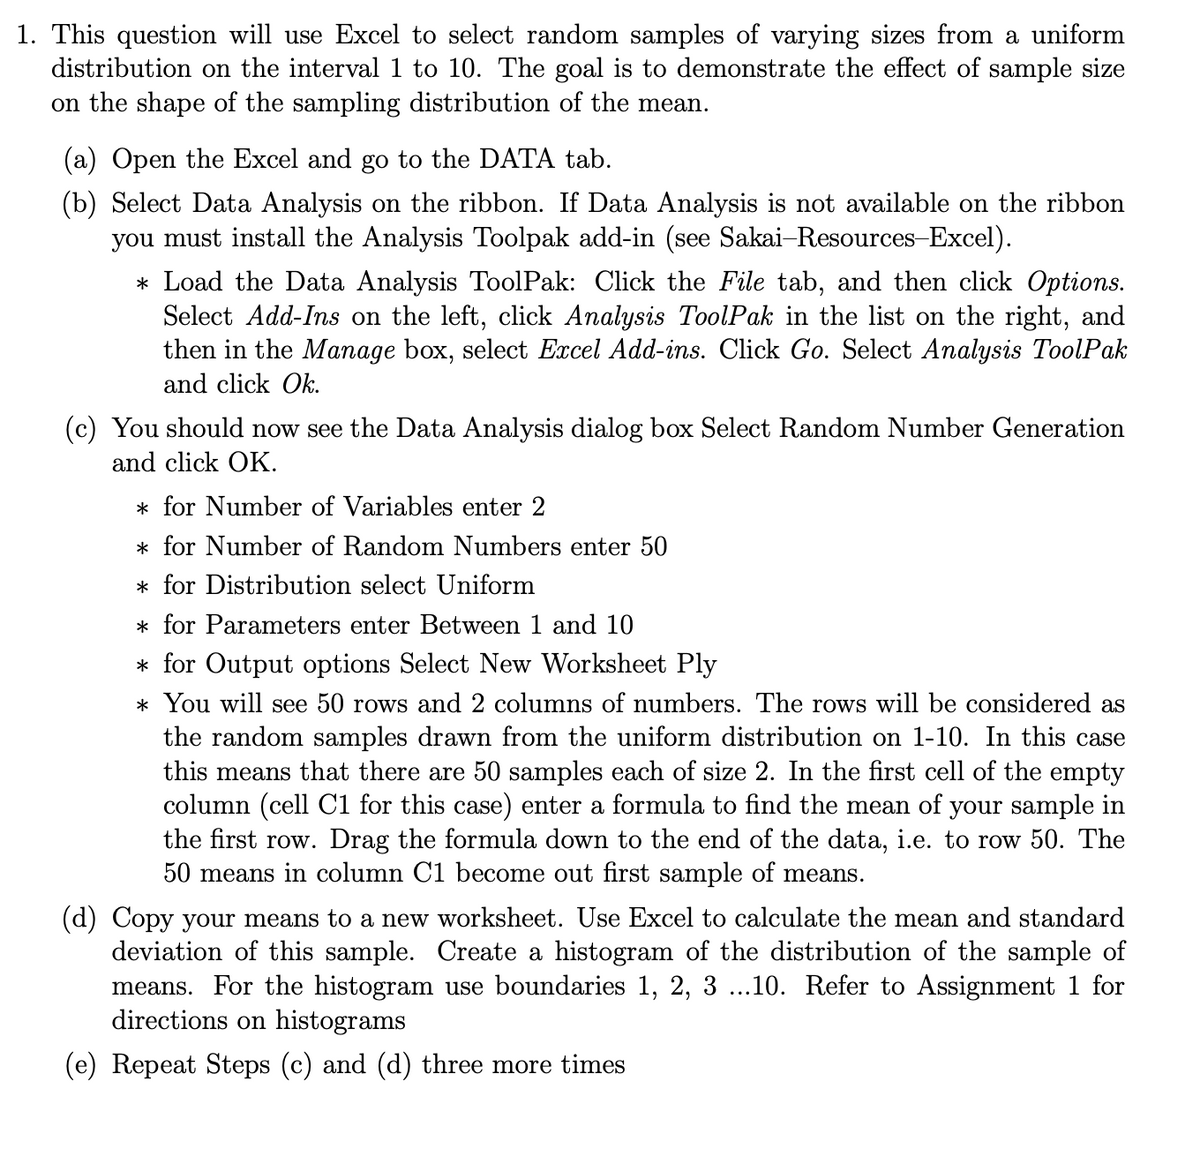
Transcribed Image Text:1. This question will use Excel to select random samples of varying sizes from a uniform
distribution on the interval 1 to 10. The goal is to demonstrate the effect of sample size
on the shape of the sampling distribution of the mean.
(a) Open the Excel and go to the DATA tab.
(b) Select Data Analysis on the ribbon. If Data Analysis is not available on the ribbon
you must install the Analysis Toolpak add-in (see Sakai-Resources-Excel).
* Load the Data Analysis ToolPak: Click the File tab, and then click Options.
Select Add-Ins on the left, click Analysis ToolPak in the list on the right, and
then in the Manage box, select Excel Add-ins. Click Go. Select Analysis ToolPak
and click Ok.
(c) You should now see the Data Analysis dialog box Select Random Number Generation
and click OK.
* for Number of Variables enter 2
* for Number of Random Numbers enter 50
* for Distribution select Uniform
* for Parameters enter Between 1 and 10
* for Output options Select New Worksheet Ply
* You will see 50 rows and 2 columns of numbers. The rows will be considered as
the random samples drawn from the uniform distribution on 1-10. In this case
this means that there are 50 samples each of size 2. In the first cell of the empty
column (cell C1 for this case) enter a formula to find the mean of your sample in
the first row. Drag the formula down to the end of the data, i.e. to row 50. The
50 means in column C1 become out first sample of means.
(d) Copy your means to a new worksheet. Use Excel to calculate the mean and standard
deviation of this sample. Create a histogram of the distribution of the sample of
means. For the histogram use boundaries 1, 2, 3 ...10. Refer to Assignment 1 for
directions on histograms
(e) Repeat Steps (c) and (d) three more times
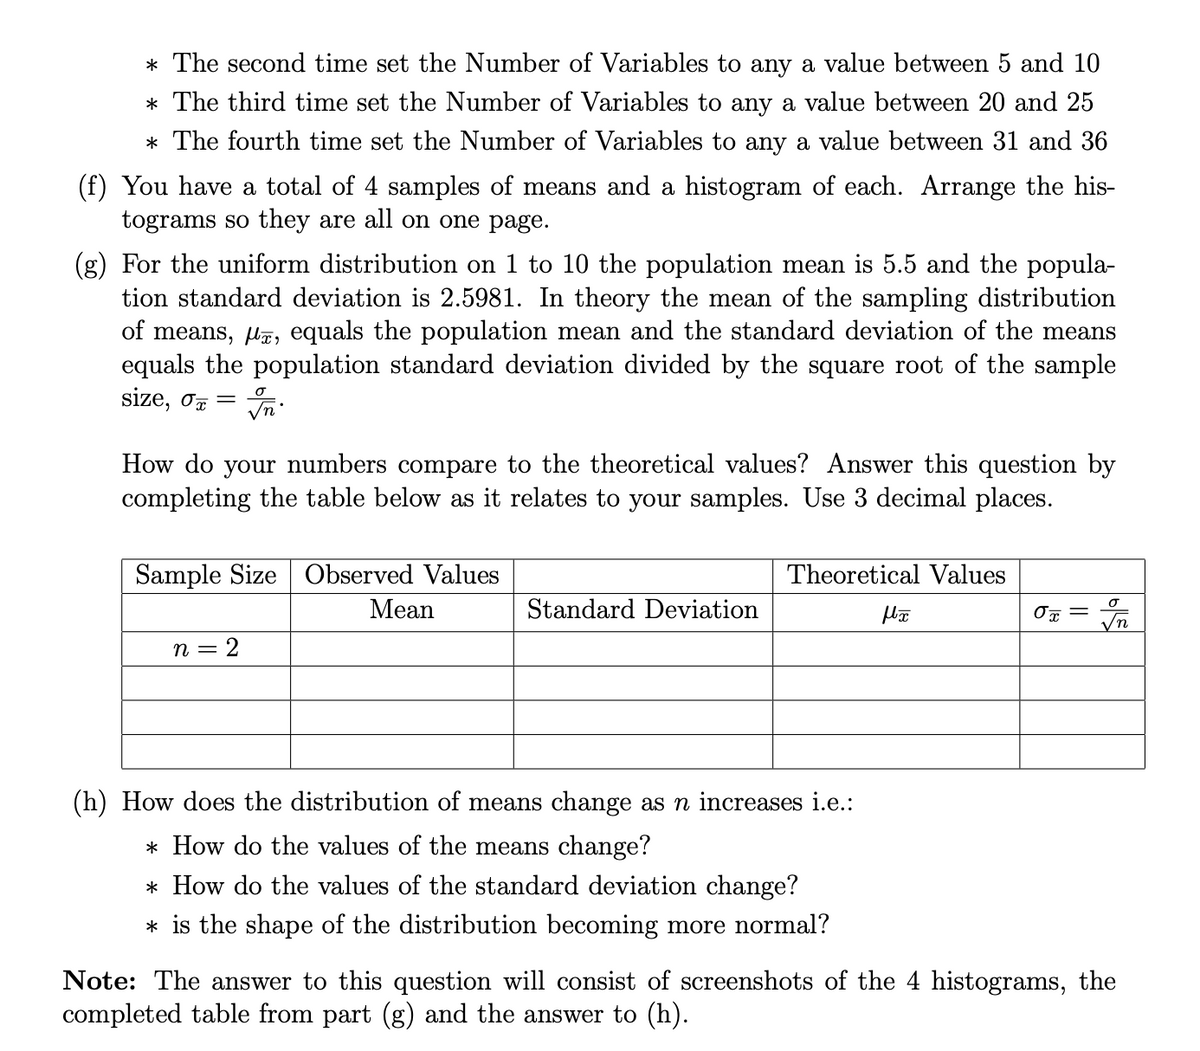
Transcribed Image Text:* The second time set the Number of Variables to any a value between 5 and 10
* The third time set the Number of Variables to any a value between 20 and 25
* The fourth time set the Number of Variables to any a value between 31 and 36
(f) You have a total of 4 samples of means and a histogram of each. Arrange the his-
tograms so they are all on one page.
(g) For the uniform distribution on 1 to 10 the population mean is 5.5 and the popula-
tion standard deviation is 2.5981. In theory the mean of the sampling distribution
of means, lz, equals the population mean and the standard deviation of the means
equals the population standard deviation divided by the square root of the sample
size, o7 =
How do your numbers compare to the theoretical values? Answer this question by
completing the table below as it relates to your samples. Use 3 decimal places.
Sample Size Observed Values
Theoretical Values
Mean
Standard Deviation
2
(h) How does the distribution of means change as n increases i.e.:
* How do the values of the means change?
* How do the values of the standard deviation change?
* is the shape of the distribution becoming more normal?
Note: The answer to this question will consist of screenshots of the 4 histograms, the
completed table from part (g) and the answer to (h).
Expert Solution
This question has been solved!
Explore an expertly crafted, step-by-step solution for a thorough understanding of key concepts.

Step by step
Solved in 2 steps with 5 images

Recommended textbooks for you
Glencoe Algebra 1, Student Edition, 9780079039897…
Algebra
ISBN:
9780079039897
Author:
Carter
Publisher:
McGraw Hill
Glencoe Algebra 1, Student Edition, 9780079039897…
Algebra
ISBN:
9780079039897
Author:
Carter
Publisher:
McGraw Hill