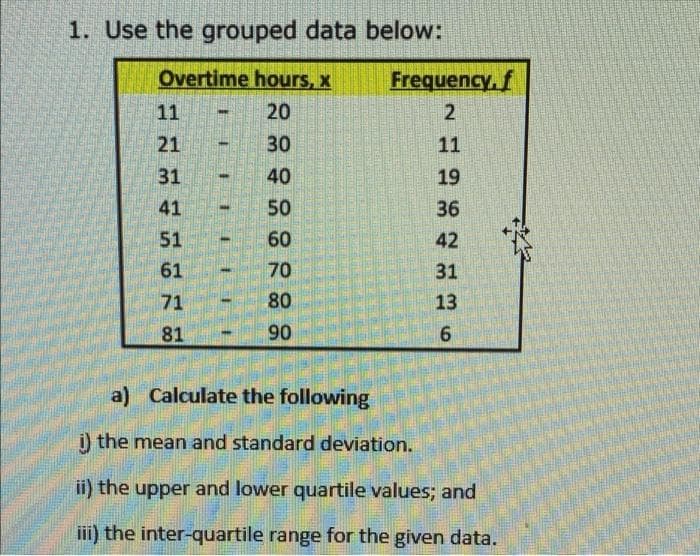
1. Use the grouped data below: Overtime hours, x Frequency, f 11 20 21 30 11 31 40 19 41 50 36 51 60 42 61 70 31 71 80 13 81 90 a) Calculate the following i) the mean and standard deviation. ii) the upper and lower quartile values; and ii) the inter-quartile range for the given data.
1. Use the grouped data below: Overtime hours, x Frequency, f 11 20 21 30 11 31 40 19 41 50 36 51 60 42 61 70 31 71 80 13 81 90 a) Calculate the following i) the mean and standard deviation. ii) the upper and lower quartile values; and ii) the inter-quartile range for the given data.

Glencoe Algebra 1, Student Edition, 9780079039897, 0079039898, 2018
18th Edition
ISBN:9780079039897
Author:Carter
Publisher:Carter
Chapter10: Statistics
Section10.5: Comparing Sets Of Data
Problem 13PPS

Related questions
Question
Transcribed Image Text:1. Use the grouped data below:
Overtime hours, x
Frequency, f
11
20
21
30
11
31
40
19
41
50
36
51
60
42
61
70
31
71
80
13
81
90
a) Calculate the following
i) the mean and standard deviation.
i) the upper and lower quartile values; and
ii) the inter-quartile range for the given data.
2.
Expert Solution
This question has been solved!
Explore an expertly crafted, step-by-step solution for a thorough understanding of key concepts.

Step by step
Solved in 5 steps with 5 images

Recommended textbooks for you
Glencoe Algebra 1, Student Edition, 9780079039897…
Algebra
ISBN:
9780079039897
Author:
Carter
Publisher:
McGraw Hill
Glencoe Algebra 1, Student Edition, 9780079039897…
Algebra
ISBN:
9780079039897
Author:
Carter
Publisher:
McGraw Hill