3 13 Calculate the mean deviation (from median) from the following data :- Class interval Frequency Class interval Frequency 1-3 3-5 5-7 7-9 53 85 56 9-11 11-13 13-15 15-17 21 26 4. 4
3 13 Calculate the mean deviation (from median) from the following data :- Class interval Frequency Class interval Frequency 1-3 3-5 5-7 7-9 53 85 56 9-11 11-13 13-15 15-17 21 26 4. 4

Glencoe Algebra 1, Student Edition, 9780079039897, 0079039898, 2018
18th Edition
ISBN:9780079039897
Author:Carter
Publisher:Carter
Chapter10: Statistics
Section10.5: Comparing Sets Of Data
Problem 13PPS

Related questions
Question
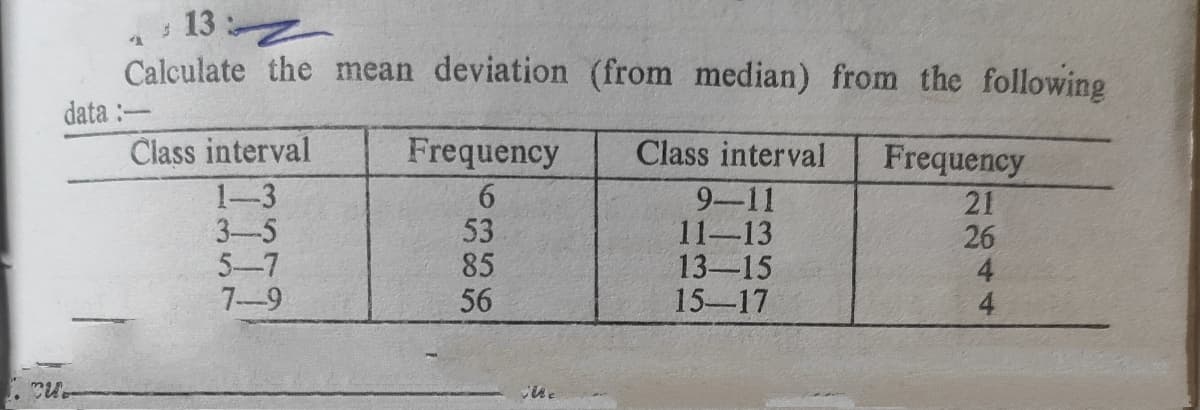
Transcribed Image Text:13 2
Calculate the mean deviation (from median) from the following
data :-
Člass interval
Frequency
Class interval
Frequency
1-3
3-5
5-7
7-9
53
85
56
9-11
11-13
13-15
15-17
21
26
4.
4
Expert Solution
This question has been solved!
Explore an expertly crafted, step-by-step solution for a thorough understanding of key concepts.

Step by step
Solved in 2 steps with 2 images

Recommended textbooks for you
Glencoe Algebra 1, Student Edition, 9780079039897…
Algebra
ISBN:
9780079039897
Author:
Carter
Publisher:
McGraw Hill
Glencoe Algebra 1, Student Edition, 9780079039897…
Algebra
ISBN:
9780079039897
Author:
Carter
Publisher:
McGraw Hill