1.) Use the line drawing tool to draw the equation Y = 1 + 1.50X. Label your line 'A'. 20- 2.) Use the line drawing tool to draw the equation Y = 18 - 1.50X. Label your line 'B'. 18- 16- 3.) Use the point drawing tool to indicate the point where both equations are equal. Label this point 'Equilibrium'. 14- Carefully follow the instructions above, and only draw the required objects. 12- a 10- 8- 6- 4- 2- 0- 6. 8. 10 12 14 16 18 20 Quantity (Q) Price P = f(Q)
1.) Use the line drawing tool to draw the equation Y = 1 + 1.50X. Label your line 'A'. 20- 2.) Use the line drawing tool to draw the equation Y = 18 - 1.50X. Label your line 'B'. 18- 16- 3.) Use the point drawing tool to indicate the point where both equations are equal. Label this point 'Equilibrium'. 14- Carefully follow the instructions above, and only draw the required objects. 12- a 10- 8- 6- 4- 2- 0- 6. 8. 10 12 14 16 18 20 Quantity (Q) Price P = f(Q)

Chapter2: Mathematics For Microeconomics
Section: Chapter Questions
Problem 2.9P

Related questions
Question
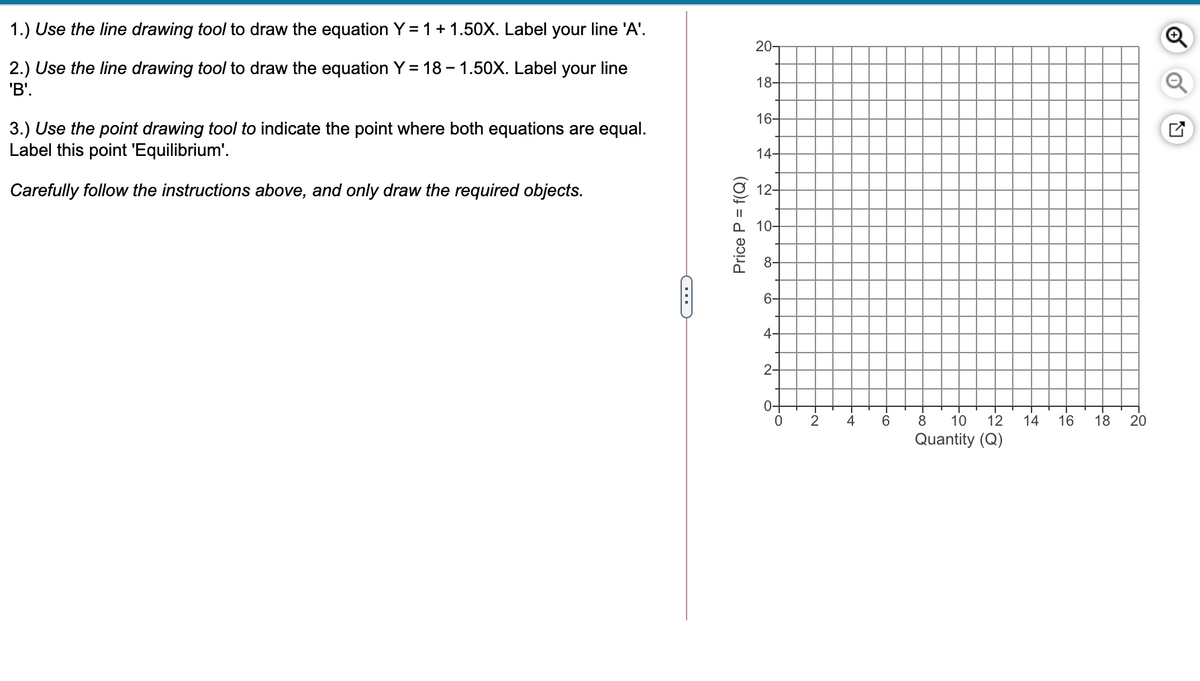
Transcribed Image Text:1.) Use the line drawing tool to draw the equation Y = 1 + 1.50X. Label your line 'A'.
20-
2.) Use the line drawing tool to draw the equation Y = 18 – 1.50X. Label your line
18-
'B'.
16-
3.) Use the point drawing tool to indicate the point where both equations are equal.
Label this point 'Equilibrium'.
14-
Carefully follow the instructions above, and only draw the required objects.
g 12-
10-
8-
6-
4-
2-
0-
4
6.
8
10
12
14
16
18
20
Quantity (Q)
Price P = f(Q)
-co
Expert Solution
This question has been solved!
Explore an expertly crafted, step-by-step solution for a thorough understanding of key concepts.

This is a popular solution!

Trending now
This is a popular solution!

Step by step
Solved in 2 steps with 1 images

Knowledge Booster


Learn more about
Need a deep-dive on the concept behind this application? Look no further. Learn more about this topic, economics and related others by exploring similar questions and additional content below.Recommended textbooks for you

Principles of Economics 2e
Economics
ISBN:
9781947172364
Author:
Steven A. Greenlaw; David Shapiro
Publisher:
OpenStax
Principles of Economics 2e
Economics
ISBN:
9781947172364
Author:
Steven A. Greenlaw; David Shapiro
Publisher:
OpenStax