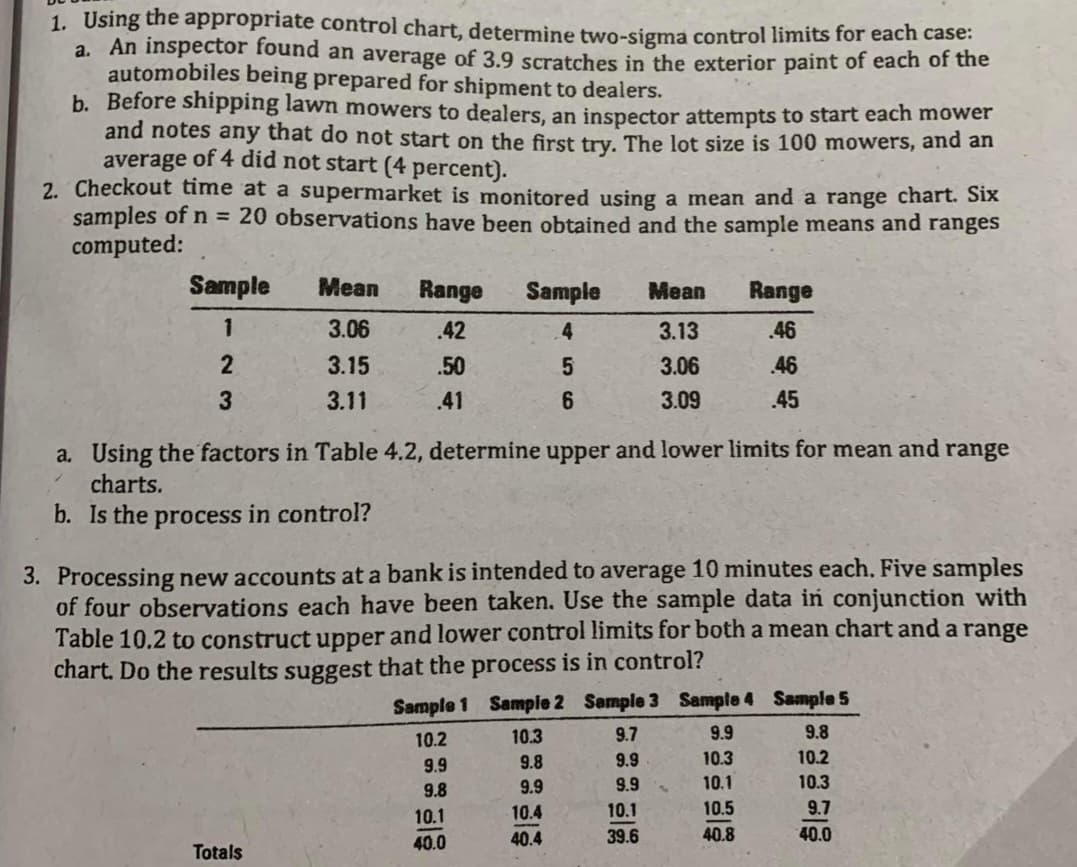
1. Using the appropriate control chart, determine two-sigma control limits for each case: a. An inspector found an average of 3.9 scratches in the exterior paint of each of the automobiles being prepared for shipment to dealers. b. Before shipping lawn mowers to dealers, an inspector attempts to start each mower and notes any that do not start on the first try. The lot size is 100 mowers, and an average of 4 did not start (4 percent). 2. Checkout time at a supermarket is monitored using a mean and a range chart. Six samples of n = 20 observations have been obtained and the sample means and ranges computed: Sample Mean Range Sample Mean Range 3.06 .42 4 3.13 46 3.15 .50 3.06 46 3.11 .41 3.09 45 a. Using the factors in Table 4.2, determine upper and lower limits for mean and range charts. b. Is the process in control? 3. Processing new accounts at a bank is intended to average 10 minutes each. Five samples of four observations each have been taken. Use the sample data iń conjunction with Table 10.2 to construct upper and lower control limits for both a mean chart and a range chart. Do the results suggest that the process is in control? Sample 1 Sample 2 Sample 3 Sample 4 Sample 5 9.8 10.2 10.3 9.7 9.9 9.9 9.8 9.9 10.3 10.2 9.8 9.9 9.9 10.1 10.3 10.1 10.4 10.1 10.5 9.7 40.0 40.4 39.6 40.8 40.0 Totals
1. Using the appropriate control chart, determine two-sigma control limits for each case: a. An inspector found an average of 3.9 scratches in the exterior paint of each of the automobiles being prepared for shipment to dealers. b. Before shipping lawn mowers to dealers, an inspector attempts to start each mower and notes any that do not start on the first try. The lot size is 100 mowers, and an average of 4 did not start (4 percent). 2. Checkout time at a supermarket is monitored using a mean and a range chart. Six samples of n = 20 observations have been obtained and the sample means and ranges computed: Sample Mean Range Sample Mean Range 3.06 .42 4 3.13 46 3.15 .50 3.06 46 3.11 .41 3.09 45 a. Using the factors in Table 4.2, determine upper and lower limits for mean and range charts. b. Is the process in control? 3. Processing new accounts at a bank is intended to average 10 minutes each. Five samples of four observations each have been taken. Use the sample data iń conjunction with Table 10.2 to construct upper and lower control limits for both a mean chart and a range chart. Do the results suggest that the process is in control? Sample 1 Sample 2 Sample 3 Sample 4 Sample 5 9.8 10.2 10.3 9.7 9.9 9.9 9.8 9.9 10.3 10.2 9.8 9.9 9.9 10.1 10.3 10.1 10.4 10.1 10.5 9.7 40.0 40.4 39.6 40.8 40.0 Totals

Glencoe Algebra 1, Student Edition, 9780079039897, 0079039898, 2018
18th Edition
ISBN:9780079039897
Author:Carter
Publisher:Carter
Chapter4: Equations Of Linear Functions
Section: Chapter Questions
Problem 8SGR

Related questions
Question
Answer number 3 only. Full solution. Unique answers only.
Transcribed Image Text:1. Using the appropriate control chart, determine two-sigma control limits for each case:
a. An inspector found an average of 3.9 scratches in the exterior paint of each of the
automobiles being prepared for shipment to dealers.
b. Before shipping lawn mowers to dealers, an inspector attempts to start each mower
and notes any that do not start on the first try. The lot size is 100 mowers, and an
average of 4 did not start (4 percent).
2. Checkout time at a supermarket is monitored using a mean and a range chart. Six
samples of n = 20 observations have been obtained and the sample means and ranges
computed:
Sample
Mean
Range
Sample
Mean
Range
1
3.06
.42
4.
3.13
46
3.15
.50
3.06
46
3.11
.41
3.09
45
a. Using the factors in Table 4.2, determine upper and lower limits for mean and range
charts.
b. Is the process in control?
3. Processing new accounts at a bank is intended to average 10 minutes each. Five samples
of four observations each have been taken. Use the sample data inń conjunction with
Table 10.2 to construct upper and lower control limits for both a mean chart and a range
chart. Do the results suggest that the process is in control?
Sample 1 Sample 2 Sample 3 Sample 4 Sample 5
9.8
10.2
10.3
9.7
9.9
9.9
9.8
9.9
10.3
10.2
9.8
9.9
9.9
10.1
10.3
10.1
10.4
10.1
10.5
9.7
40.4
39.6
40.8
40.0
40.0
Totals
Expert Solution
This question has been solved!
Explore an expertly crafted, step-by-step solution for a thorough understanding of key concepts.

This is a popular solution!

Trending now
This is a popular solution!

Step by step
Solved in 3 steps with 3 images

Recommended textbooks for you
Glencoe Algebra 1, Student Edition, 9780079039897…
Algebra
ISBN:
9780079039897
Author:
Carter
Publisher:
McGraw Hill
Glencoe Algebra 1, Student Edition, 9780079039897…
Algebra
ISBN:
9780079039897
Author:
Carter
Publisher:
McGraw Hill