Regression. A coach wants to see the relationship between the statistics of practice games and official games of a local soccer team. A sample of 14 players was used and the resulting (partial) Excel output is shown below. Assume both x and y form normal distributions. Regression Multiple R R Square Adjusted R Square Standard Error Observations OA. -0.8398 OB. 0.8398 Statistics (a) The slope of the regression line is OA. 0.757 OB. 4.373 OC. 0.177 O D. 40.541 0.70524 0.668395 8.703633 14 (b) The correlation coefficient is Coefficients Standard Error OC. H, :p *0 OC. None of the other answers OD. 0.705 OD. H₂H 0 t Stat P-value Lower 95% A hypothesis test is done to determine whether the correlation coefficient is significantly different from zero. (c) The alternate hypothesis is OA. H₁ : BO OB. H₁ :p = 0 Upper 95%
Regression. A coach wants to see the relationship between the statistics of practice games and official games of a local soccer team. A sample of 14 players was used and the resulting (partial) Excel output is shown below. Assume both x and y form normal distributions. Regression Multiple R R Square Adjusted R Square Standard Error Observations OA. -0.8398 OB. 0.8398 Statistics (a) The slope of the regression line is OA. 0.757 OB. 4.373 OC. 0.177 O D. 40.541 0.70524 0.668395 8.703633 14 (b) The correlation coefficient is Coefficients Standard Error OC. H, :p *0 OC. None of the other answers OD. 0.705 OD. H₂H 0 t Stat P-value Lower 95% A hypothesis test is done to determine whether the correlation coefficient is significantly different from zero. (c) The alternate hypothesis is OA. H₁ : BO OB. H₁ :p = 0 Upper 95%

Big Ideas Math A Bridge To Success Algebra 1: Student Edition 2015
1st Edition
ISBN:9781680331141
Author:HOUGHTON MIFFLIN HARCOURT
Publisher:HOUGHTON MIFFLIN HARCOURT
Chapter11: Data Analysis And Displays
Section11.4: Two-ways Tables
Problem 12E

Related questions
Question
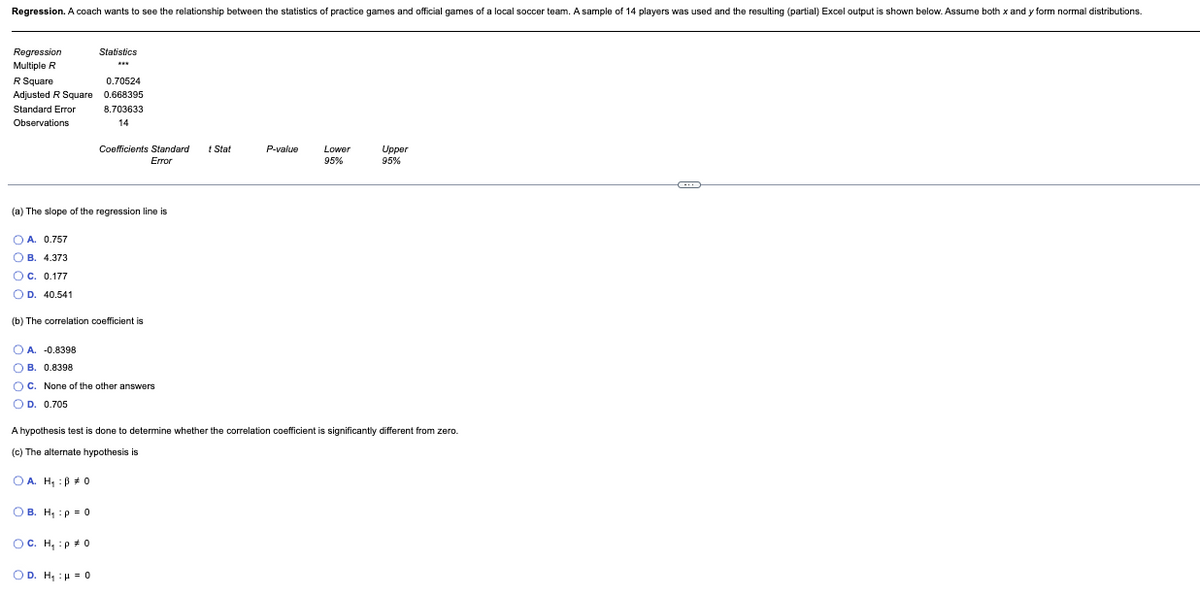
Transcribed Image Text:Regression. A coach wants to see the relationship between the statistics of practice games and official games of a local soccer team. A sample of 14 players was used and the resulting (partial) Excel output is shown below. Assume both x and y form normal distributions.
Regression
Multiple R
R Square
Adjusted R Square
Standard Error
Observations
Statistics
0.70524
0.668395
8.703633
14
(a) The slope of the regression line ist
Coefficients Standard
Error
O A. 0.757
OB. 4.373
OC. 0.177
O D. 40.541
(b) The correlation coefficient is
OB. H₁: p = 0
OA. -0.8398
OB. 0.8398
OC. None of the other answers
O D. 0.705
OC. H₁ :p #0
OD. H₁:μ = 0
t Stat
P-value
Lower
95%
A hypothesis test is done to determine whether the correlation coefficient is significantly different from zero.
(c) The alternate hypothesis is
OA. H₁ : ³ 0
Upper
95%
C
Expert Solution
This question has been solved!
Explore an expertly crafted, step-by-step solution for a thorough understanding of key concepts.

Step by step
Solved in 4 steps with 4 images

Recommended textbooks for you
Big Ideas Math A Bridge To Success Algebra 1: Stu…
Algebra
ISBN:
9781680331141
Author:
HOUGHTON MIFFLIN HARCOURT
Publisher:
Houghton Mifflin Harcourt
Big Ideas Math A Bridge To Success Algebra 1: Stu…
Algebra
ISBN:
9781680331141
Author:
HOUGHTON MIFFLIN HARCOURT
Publisher:
Houghton Mifflin Harcourt