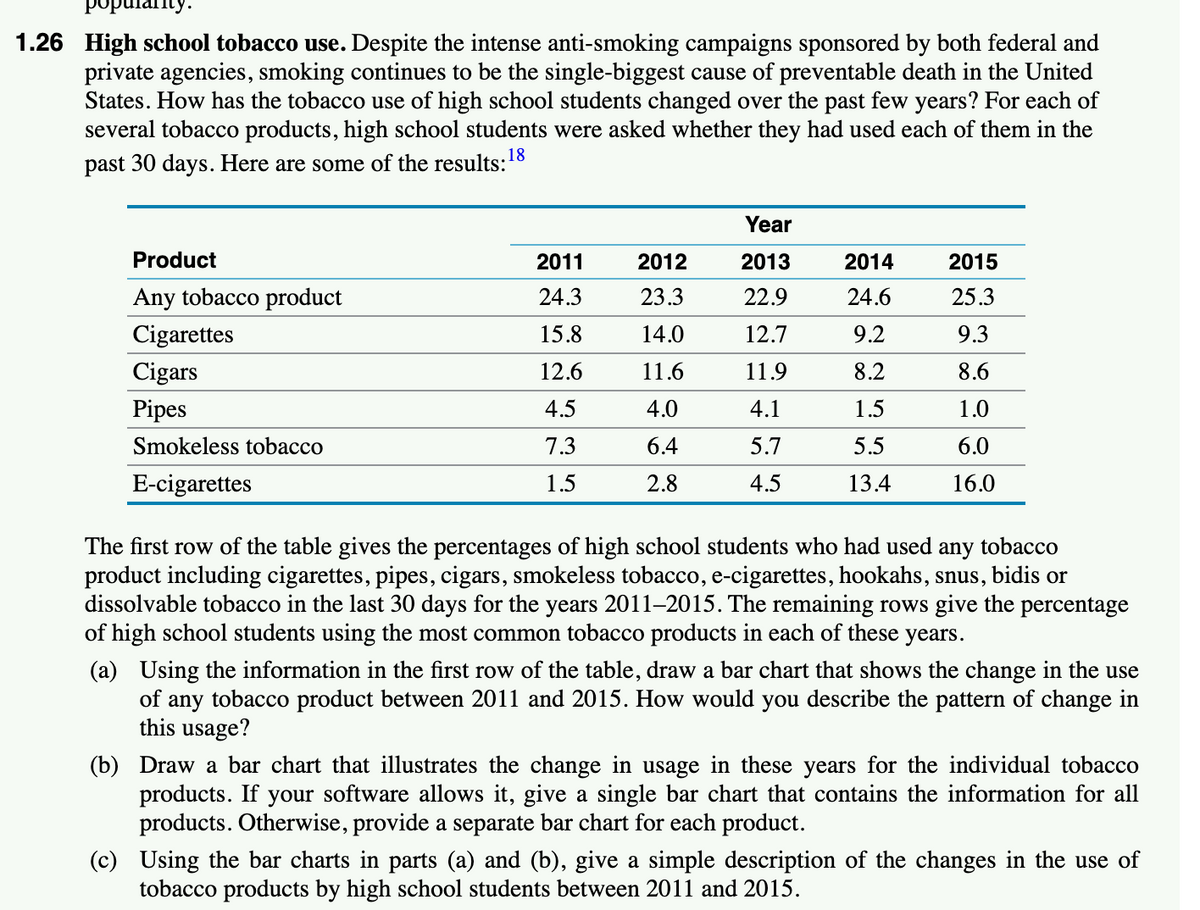
1.26 High school tobacco use. Despite the intense anti-smoking campaigns sponsored by both federal and private agencies, smoking continues to be the single-biggest cause of preventable death in the United States. How has the tobacco use of high school students changed over the past few years? For each of several tobacco products, high school students were asked whether they had used each of them in the past 30 days. Here are some of the results:18 Year Product 2011 2012 2013 2014 2015 Any tobacco product 24.3 23.3 22.9 24.6 25.3 Cigarettes 15.8 14.0 12.7 9.2 9.3 Cigars 12.6 11.6 11.9 8.2 8.6 Pipes 4.5 4.0 4.1 1.5 1.0 Smokeless tobacco 7.3 6.4 5.7 5.5 6.0 E-cigarettes 1.5 2.8 4.5 13.4 16.0 The first row of the table gives the percentages of high school students who had used any tobacco product including cigarettes, pipes, cigars, smokeless tobacco, e-cigarettes, hookahs, snus, bidis or dissolvable tobacco in the last 30 days for the years 2011–2015. The remaining rows give the percentage of high school students using the most common tobacco products in each of these years. (a) Using the information in the first row of the table, draw a bar chart that shows the change in the use of any tobacco product between 2011 and 2015. How would you describe the pattern of change in this usage? (b) Draw a bar chart that illustrates the change in usage in these years for the individual tobacco products. If your software allows it, give a single bar chart that contains the information for all products. Otherwise, provide a separate bar chart for each product. (c) Using the bar charts in parts (a) and (b), give a simple description of the changes in the use of tobacco products by high school students between 2011 and 2015.
1.26 High school tobacco use. Despite the intense anti-smoking campaigns sponsored by both federal and private agencies, smoking continues to be the single-biggest cause of preventable death in the United States. How has the tobacco use of high school students changed over the past few years? For each of several tobacco products, high school students were asked whether they had used each of them in the past 30 days. Here are some of the results:18 Year Product 2011 2012 2013 2014 2015 Any tobacco product 24.3 23.3 22.9 24.6 25.3 Cigarettes 15.8 14.0 12.7 9.2 9.3 Cigars 12.6 11.6 11.9 8.2 8.6 Pipes 4.5 4.0 4.1 1.5 1.0 Smokeless tobacco 7.3 6.4 5.7 5.5 6.0 E-cigarettes 1.5 2.8 4.5 13.4 16.0 The first row of the table gives the percentages of high school students who had used any tobacco product including cigarettes, pipes, cigars, smokeless tobacco, e-cigarettes, hookahs, snus, bidis or dissolvable tobacco in the last 30 days for the years 2011–2015. The remaining rows give the percentage of high school students using the most common tobacco products in each of these years. (a) Using the information in the first row of the table, draw a bar chart that shows the change in the use of any tobacco product between 2011 and 2015. How would you describe the pattern of change in this usage? (b) Draw a bar chart that illustrates the change in usage in these years for the individual tobacco products. If your software allows it, give a single bar chart that contains the information for all products. Otherwise, provide a separate bar chart for each product. (c) Using the bar charts in parts (a) and (b), give a simple description of the changes in the use of tobacco products by high school students between 2011 and 2015.

Functions and Change: A Modeling Approach to College Algebra (MindTap Course List)
6th Edition
ISBN:9781337111348
Author:Bruce Crauder, Benny Evans, Alan Noell
Publisher:Bruce Crauder, Benny Evans, Alan Noell
Chapter5: A Survey Of Other Common Functions
Section5.3: Modeling Data With Power Functions
Problem 6E: Urban Travel Times Population of cities and driving times are related, as shown in the accompanying...

Related questions
Topic Video
Question
Transcribed Image Text:Populanty.
1.26 High school tobacco use. Despite the intense anti-smoking campaigns sponsored by both federal and
private agencies, smoking continues to be the single-biggest cause of preventable death in the United
States. How has the tobacco use of high school students changed over the past few years? For each of
several tobacco products, high school students were asked whether they had used each of them in the
18
past 30 days. Here are some of the results:
Year
Product
2011
2012
2013
2014
2015
Any tobacco product
24.3
23.3
22.9
24.6
25.3
Cigarettes
15.8
14.0
12.7
9.2
9.3
Cigars
12.6
11.6
11.9
8.2
8.6
Pipes
4.5
4.0
4.1
1.5
1.0
Smokeless tobacco
7.3
6.4
5.7
5.5
6.0
E-cigarettes
1.5
2.8
4.5
13.4
16.0
The first row of the table gives the percentages of high school students who had used any tobacco
product including cigarettes, pipes, cigars, smokeless tobacco, e-cigarettes, hookahs, snus, bidis or
dissolvable tobacco in the last 30 days for the years 2011–2015. The remaining rows give the percentage
of high school students using the most common tobacco products in each of these years.
(a) Using the information in the first row of the table, draw a bar chart that shows the change in the use
of any tobacco product between 2011 and 2015. How would you describe the pattern of change in
this usage?
(b) Draw a bar chart that illustrates the change in usage in these years for the individual tobacco
products. If your software allows it, give a single bar chart that contains the information for all
products. Otherwise, provide a separate bar chart for each product.
(c) Using the bar charts in parts (a) and (b), give a simple description of the changes in the use of
tobacco products by high school students between 2011 and 2015.
Expert Solution
This question has been solved!
Explore an expertly crafted, step-by-step solution for a thorough understanding of key concepts.

This is a popular solution!

Trending now
This is a popular solution!

Step by step
Solved in 3 steps with 2 images

Knowledge Booster


Learn more about
Need a deep-dive on the concept behind this application? Look no further. Learn more about this topic, statistics and related others by exploring similar questions and additional content below.Recommended textbooks for you
Functions and Change: A Modeling Approach to Coll…
Algebra
ISBN:
9781337111348
Author:
Bruce Crauder, Benny Evans, Alan Noell
Publisher:
Cengage Learning

Glencoe Algebra 1, Student Edition, 9780079039897…
Algebra
ISBN:
9780079039897
Author:
Carter
Publisher:
McGraw Hill

Holt Mcdougal Larson Pre-algebra: Student Edition…
Algebra
ISBN:
9780547587776
Author:
HOLT MCDOUGAL
Publisher:
HOLT MCDOUGAL
Functions and Change: A Modeling Approach to Coll…
Algebra
ISBN:
9781337111348
Author:
Bruce Crauder, Benny Evans, Alan Noell
Publisher:
Cengage Learning
Glencoe Algebra 1, Student Edition, 9780079039897…
Algebra
ISBN:
9780079039897
Author:
Carter
Publisher:
McGraw Hill
Holt Mcdougal Larson Pre-algebra: Student Edition…
Algebra
ISBN:
9780547587776
Author:
HOLT MCDOUGAL
Publisher:
HOLT MCDOUGAL