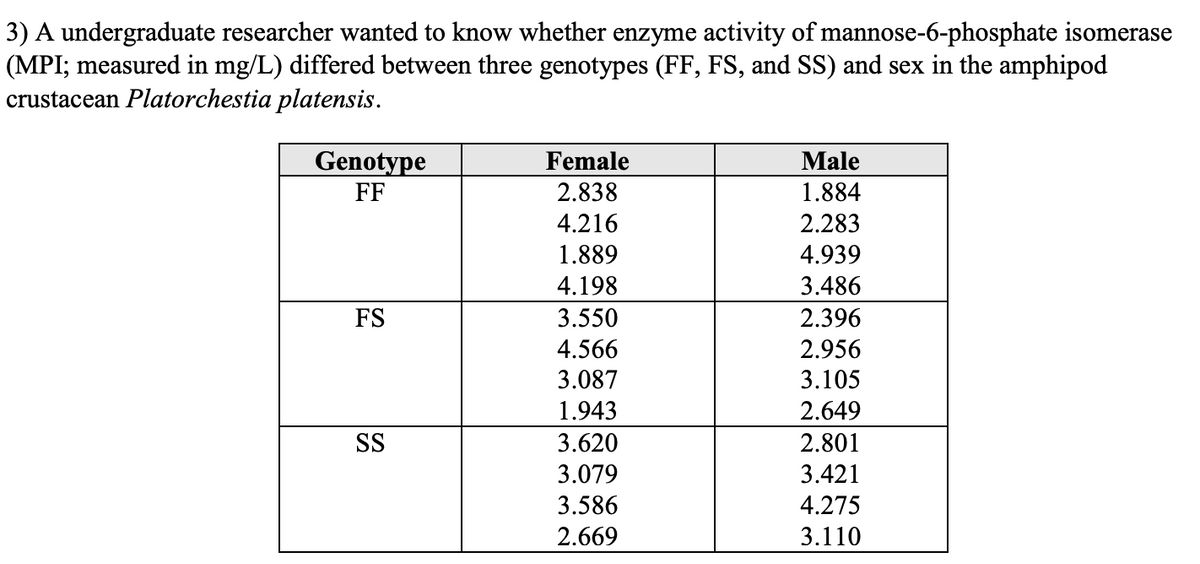
3) A undergraduate researcher wanted to know whether enzyme activity of mannose-6-phosphate isomerase (MPI; measured in mg/L) differed between three genotypes (FF, FS, and SS) and sex in the amphipod crustacean Platorchestia platensis. Genotype FF Female Male 2.838 1.884 4.216 2.283 1.889 4.939 4.198 3.486 FS 3.550 2.396 2.956 4.566 3.087 3.105 1.943 2.649 SS 3.620 2.801 3.079 3.421 3.586 4.275 2.669 3.110


Q: The article “Effects of Diets with Whole Plant-Origin Proteins Added with Different Ratiosof…
A:
Q: A study at the physics laboratory at Istanbul Kültür University is made to examine the defects in an…
A: Chi square test for independence: Chi square test is used to test whether the two categorical…
Q: 2. A study was conducted to determine the level of cyanide in 20 exposed spot (soil and water)…
A: Given :
Q: 2 6. Investigate the association between eye colour of husbands and eye colour of wives from the…
A:
Q: Study is conducted involving 14 infants to investigate the association between gestational age at…
A: Correlation is used to find the association between two variables which can be obtained using excel…
Q: An artide in the IEEE Transactions on Components, Hybrids, and Manufacturing Technology (Vol. 15,…
A:
Q: 1.The manager of an auto dealership would like to develop a model the fuel consumption of various…
A: Given data represents fuel consumption of various car models based on engine size. Here, The…
Q: The article “The Selection of Yeast Strains for the Production of Premium Quality South African…
A:
Q: An artide in the IEEE Transactions on Components, Hybrids, and Manufacturing Technology (Vol. 15,…
A: given data
Q: The following table was presented in a article summarizing a study to compare a new drug to a…
A: Given: The table presented in a article summarizing a study to compare a new drug to a standard drug…
Q: NO AGE - SEX:- PROGRAMME- Hours spent study GPA 23 Male BB05 4 3.67 2 21 Female ВвO8 ЗА 2 3.90 22…
A: Solution: First step to find the mean and standard deviation of hours spend for studying and current…
Q: PCBs and Pelicans. Polychlorinated biphenyls (PCBs), industrial pollutants, are known to be…
A: The data represents histogram of the concentration of PCBs (polychlorinated biphenyls) and pelicans…
Q: An article reported on a study in which each of 13 workers was provided with both a conventional…
A: Given: α=0.05 μd=μconventional-μperforated X: Conventional Y: Perforated
Q: A random sample of n, 10 regions in New England gave the following violent crime rates (per milion…
A: Given: n1 = 10 n2 = 12 Formula Used: Mean X = ∑Xin Sample standard deviation S = ∑Xi-X2n-1…
Q: The manager of an auto dealership would like to develop a model the fuel consumption of various car…
A: Excel Procedure: Enter Engine Size and Fuel Consumption in Excel>Data>Data Analysis>…
Q: Consider the following data on 20 chemical reactions, with Y = chromatographic retention time…
A: a) Line of best of the data: The line that best fits the data is least-squares regression line. The…
Q: 7. The following table cross-classifies pregnant women in the study by their body mass index (BMI)…
A: From the provided information, The table can be constructed as:
Q: 4. A study was designed to measure the difference in diastolic blood pressure readings between men…
A: From the given information. The provided data is-…
Q: The table below gives data on average per capita wine consumption and heart disease rates in 19…
A: i, Since the sign of r indicates the slope of the least squares line, hence, it is Not possible for…
Q: Suppose a researcher is interested in investigating the effectiveness of a new medication aimed to…
A:
Q: 2. A study was conducted to determine the level of cyanide in 20 exposed spot (soil and water)…
A: Since you have posted a question with multiple sub-parts, we will solve first three sub-parts for…
Q: Is there any significant difference in the impact of procrastination in academic performance of the…
A: Given information: STRONGLY AGREE AGREE DISAGREE STRONGLY DISAGREE Total ABM 11 21 30 23 85…
Q: Suppose that we want to compare the cholestrol contents of four competing diet foods on the basis of…
A:
Q: 2. ABM 11 students believe on the value of thriftiness. That is why they conducted a research on…
A: Since you have asked multiple questions, we will solve the first question for you. If you want any…
Q: PCBs and Pelicans. Polychlorinated biphenyls (PCBs), industrial pollutants, are known to be…
A:
Q: A random sample of soil specimens was obtained, and the amount of organic matter (%) in the soil was…
A: In this context, the aim is to test whether the true average percentage of organic matter in such…
Q: A poll surveyed people in six countries to assess attitudes toward a variety of alternate forms of…
A: a) Given data, The sample size is 6451. Null hypothesis: The attitude toward building new nuclear…
Q: 4.13 The effect of three different lubricating oils on fuel economy in diesel truck engines is being…
A:
Q: 2.890 A consumer buying cooperative tested the effective heating area of 20 different electric space…
A: The independent variable is Wattage. The dependent variable is Area. We have to do correlation and…
Q: Is there any significant difference in the impact of procrastination in academic performance of the…
A: Given:
Q: An article in Technometrics presented the following data on the motor fuel several blends of…
A:
Q: Assume a univariate quantitative data set, which contains fifty observations, has been organized by…
A: We have to answer question related to frequency distribution table.
Q: Assume a univariate quantitative data set, which contains fifty observations, has been organized by…
A: From the given information, cf1=9rf2=0.04f3=1 There are 50 observations. By adding 20 more…
Q: The following data were obtained from an independent-measures study comparing three treatment…
A: Tukey's HSD test is used when at least one group differs from the rest of the groups. The test…
Q: 1) The following data show the results of a study based on the number of hours college students…
A: Hi! Thank you for the question, As per the honor code, we are allowed to answer three sub-parts at a…
Q: To understand better the effects of exercise ang aging on various circulatory functions, the article…
A: The given data is 12.81, 14.95, 15.83, 15.97, 17.9, 18.27, 18.34, 19.82, 19.94, 20.62, 20.88, 20.93,…
Q: Listed below are amounts of strontium-90 (in milibecquerels, or mBa) in a simple random sample of…
A:
Q: Department of Research and Development of Unilever Sdn Bhd has condi study to improve the quality of…
A: Given: n = 50
Q: 1. The manager of an auto dealership would like to develop a model the fuel consumption of various…
A: Given information: The data is provided consisting of various car models, their engine size, and…
Q: An article in the Food Technology Journal (1956, Vol. 10, pp. 39-42) described a study on the…
A: a) Solution: Since p-value<α, H0 is rejected. Some of the groups' averages consider to be not…
Q: To investigate the question of whether the Brinell hardness of two materials A.and Bis difterent, 10…
A: As per or guidelines,we are allowed to answer first three sub-parts only. Thanks First we will…
Q: The results of an experimental drug trial to treat chronic stultitia are listed below. Women without…
A: Given data, P(Man in treatment 2 will show marked improvement)=?
Q: In birds, wingspan is determined by two genes, one with complete dominance of one allele over the…
A: Note: According to our guidelines, we can answer only first three sub-part questions. Kindly, repost…
Q: 7. A paper in Quality Engineering [2013, Vol. 25(1)] presented data on cycles to failure of solder…
A: Given the Failure data for two temperatures (20 and 60°C) for a coppernickel-gold PCB as follow:…
Q: Which of the following is correct? I. In a retrospective study, the researcher deliberate or…
A: Observational study: If the researcher observes the behavior of the units in the study and provides…
Q: 7. A paper in Quality Engineering [2013, Vol. 25(1)] presented data on cycles to failure of solder…
A:
Q: The article "The Selection of Yeast Strains for the Production of Premium Quality South African…
A: Note: Thank you for the question. Since multiple subparts are posted, according to our policy, we…
Q: 4. Consider the following data from a cross-sectional study to find association between yitamin D…
A:
Q: 3. During each of four experiments on the use of carbon tetrachloride as a worm killer, ten rats…
A: We want to test whether there are significant difference among the groups by using ANOVA table
How do I go about setting up this problem? Do I start by finding the mean for each column? I think I need to use a 2-way ANOVA for this or Friedman's test. The data is


Trending now
This is a popular solution!

Step by step
Solved in 2 steps with 2 images


- 1. Suppose that, in Example 2.27, 400 units of food A, 600 units of B, and 600 units of C are placed in the test tube each day and the data on daily food consumption by the bacteria (in units per day) are as shown in Table 2.6. How many bacteria of each strain can coexist in the test tube and consume all of the food? Table 2.6 Bacteria Strain I Bacteria Strain II Bacteria Strain III Food A 1 2 0 Food B 2 1 1 Food C 1 1 2The article “Effects of Diets with Whole Plant-Origin Proteins Added with Different Ratiosof Taurine:Methionine on the Growth, Macrophage Activity and Antioxidant Capacity ofRainbow Trout (Oncorhynchus mykiss) Fingerlings” (O. Hernandez, L. Hernandez, et al.,Veterinary and Animal Science, 2017:4-9) reports that a sample of 210 juvenile rainbowtrout fed a diet fortified with equal amounts of the amino acids taurine and methionine for aperiod of 70 days had a mean weight gain of 313 percent with a standard deviation of 25, while 210 fish fed with a control diet had a mean weight gain of 233 percent with a standard deviation of 19. Units are percent. Find a 99% confidence interval for the difference in weight gain on the two diets.In an experiment to determine the effect of ambient temperature on the emissons of oxides of nitrogen ( NOx ) of diesel trucks, 10 trucks were run at temperatures of 40°F and 80°F . The emissions, in parts per billion, are presented in the following table. Truck 40°F 80°F 1 926.5 896.7 2 851.1 857.0 3 975.5 952.1 4 1009.3 884.8 5 871.8 840.7 6 949.2 885.1 7 1006.3 885.5 8 836.5 777.8 9 837.8 850.2 10 958.9 882.1 Send data to Excel Let μ1 represent the mean emission at 40°F and =μd−μ1μ2 .Can you conclude that the mean emission differs between the two temperatures? Use the =α0.05 level of significance and the TI-84 Plus calculator to answer the following. p value ? do we reject? is there enough evidence :?
- 5.39 ● The following data on degree of exposure to 242Cmalpha particles (x) and the percentage of exposed cellswithout aberrations (y) appeared in the paper “Chromosome Aberrations Induced in Human Lymphocytes by D-TNeutrons” (Radiation Research [1984]: 561–573):An article reported data from a study in which both a baseline gasoline mixture and a reformulated gasoline were used. Consider the following observations on age (yr) and NOx emissions (g/kWh): Engine 1 2 3 4 5 6 7 8 9 10 Age 0 0 2 11 7 16 9 0 12 4 Baseline 1.74 4.38 4.04 1.23 5.30 0.58 3.35 3.44 0.73 1.23 Reformulated 1.85 5.93 5.52 2.67 6.54 0.76 4.94 4.87 0.69 1.39 Construct scatter plots of the baseline NOx emissions versus age. Construct scatter plots of the reformulated NOx emissions versus age. What appears to be the nature of the relationship between these two variables? As age increases, emissions also increase.As age increases, emissions decrease. There is no compelling relationship between the data.An article reported data from a study in which both a baseline gasoline mixture and a reformulated gasoline were used. Consider the following observations on age (yr) and NOx emissions (g/kWh): Engine 1 2 3 4 5 6 7 8 9 10 Age 0 0 2 11 7 16 9 0 12 4 Baseline 1.70 4.38 4.06 1.24 5.29 0.59 3.35 3.45 0.73 1.22 Reformulated 1.86 5.91 5.51 2.70 6.50 0.71 4.95 4.86 0.72 1.41 Construct scatter plots of the baseline NOx emissions versus age. What appears to be the nature of the relationship between these two variables? There is no compelling relationship between the data. As age increases, emissions also increase. As age increases, emissions decrease.
- A researcher is interested in testing the relationship between smoking and BMI (kg/m2) in adults aged 30-45. In order to test this association, the researcher divides smoking into currently more than a pack a day, currently less than a pack a day, and never smokers. The following table represents the BMIs for each participant enrolled by their respective smoking category. Current Smoker (≥1pack/day) Current Smoker (<1 pack/day Never Smoked 26.7 29.4 22.1 29.4 28.6 30.4 24.3 27.4 21.3 28.4 23.2 26.4 21.6 20.1 19.7 27.4 20.6 19.8 26.8 19.7 21.6 36.4 19.6 22.3 31.5 21.6 24.3 27.4 21.5 *Continue as though all assumptions for ANOVA are met. A) Calculate the MSW and MSB for the data represented above. B) Carry out a formal test for a one-way analysis of variance among the groups and interpret your results.The following table was presented in a article summarizing a study to compare a new drug to a standard drug and to a placebo. characteristic new drug stand. drug placebo p age,yrs 45.2(4.8) 44.9(5.1) 42.8(4.3) 0.5746 % female 50% 55% 57% 0.1635 annual income,$000s 59.5%(14.3) 63.8(16.9) 58.2%(13.1) 0.4635 % w/ins 87% 65% 82% 0.0352 disease stage 0.0261 stage 1 35% 18% 33% stage 2 42% 37% 47% stage 3 23% 51% 20% Are there any statistiscally significant differences…PCBs and Pelicans. Polychlorinated biphenyls (PCBs), industrial pollutants, are known to be carcinogens and a great danger to natural ecosystems. As a result of several studies, PCB production was banned in the United States in 1979 and by the Stockholm Convention on Persistent Organic Pollutants in 2001. One study, published in 1972 by R. Risebrough, is titled “Effects of Environmental Pollutants Upon Animals Other Than Man” (Proceedings of the 6th Berkeley Symposium on Mathematics and Statistics, VI, University of California Press, pp. 443–463). In that study, 60 Anacapa pelican eggs were collected and measured for their shell thickness, in millimeters (mm), and concentration of PCBs, in parts per million (ppm). The data are on the WeissStats site. a. obtain and interpret the standard error of the estimate. b. obtain a residual plot and a normal probability plot of the residuals. c. decide whether you can reasonably consider Assumptions 1–3 for regression inferences met by the two…
- An automotive engineer is investigating two different types of metering devices for an electronic fuel injection system to determine whether they differ in their fuel mileage performance. The system is installed on 10 different cars, and a test is run with each metering device on each car. The data is provided below: Metering Device Car 1 2 1 17.6 16.8 2 19.4 20.0 3 18.2 17.6 4 17.1 16.4 5 15.3 16.0 6 15.9 15.9 7 16.3 16.5 8 18.0 18.4 9 17.3 16.4 10 19.1 20.1 Is there a significant difference between the means of the two metering devices? Use . Interpret the result in the context of the problem. An article in the journal Hazardous Waste and Hazardous Materials (Vol. 6, 1989) reported the results of an analysis of the weight of calcium in standard cement and cement doped with lead. Reduced levels of calcium would indicate that the hydration mechanism in the cement is blocked…The article “Effect of Varying Solids Concentration and Organic Loading on the Performance of Temperature Phased Anaerobic Digestion Process” (S. Vandenburgh and T. Ellis, Water Environment Research, 2002:142–148) discusses experiments to determine the effect of the solids concentration on the performance of treatment methods for wastewater sludge. In the first experiment, the concentration of solids (in g/L) was 43.94 ± 1.18. In the second experiment, which was independent of the first, the concentration was 48.66 ± 1.76. Estimate the difference in the concentration between the two experiments, and find the uncertainty in the estimate.The number of contaminating particles on a silicon waferprior to a certain rinsing process was determined for eachwafer in a sample of size 100, resulting in the followingfrequencies:Number of particles 0 1 2 3 4 5 6 7Frequency 1 2 3 12 11 15 18 10Number of particles 8 9 10 11 12 13 14Frequency 12 4 5 3 1 2 1a. What proportion of the sampled wafers had at leastone particle? At least five particles?b. What proportion of the sampled wafers had betweenfive and ten particles, inclusive? Strictly between fiveand ten particles?c. Draw a histogram using relative frequency on thevertical axis. How would you describe the shape of thehistogram?