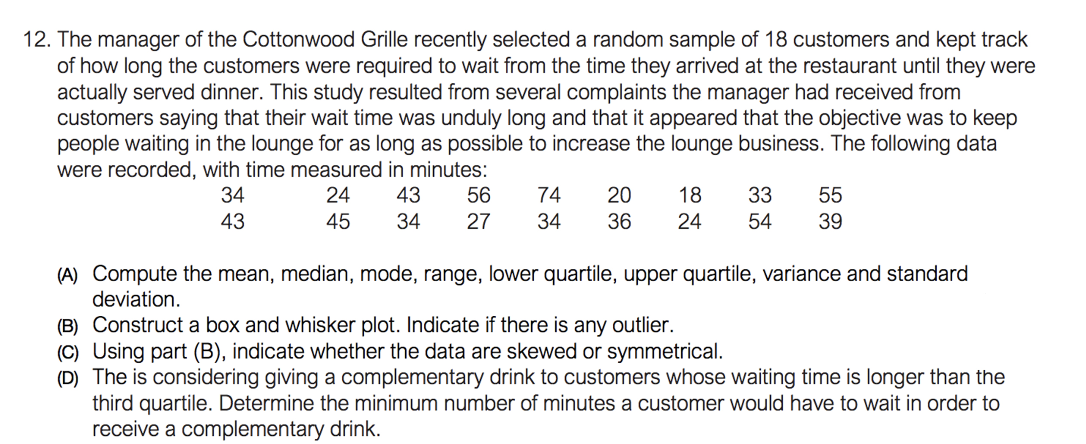
12. The manager of the Cottonwood Grille recently selected a random sample of 18 customers and kept track of how long the customers were required to wait from the time they arrived at the restaurant until they were actually served dinner. This study resulted from several complaints the manager had received from customers saying that their wait time was unduly long and that it appeared that the objective was to keep people waiting in the lounge for as long as possible to increase the lounge business. The following data were recorded, with time measured in minutes: 34 24 43 56 74 20 18 33 55 43 45 34 27 34 36 24 54 39 (A) Compute the mean, median, mode, range, lower quartile, upper quartile, variance and standard deviation. (B) Construct a box and whisker plot. Indicate if there is any outlier. (C) Using part (B), indicate whether the data are skewed or symmetrical. (D) The is considering giving a complementary drink to customers whose waiting time is longer than the third quartile. Determine the minimum number of minutes a customer would have to wait in order to receive a complementary drink
12. The manager of the Cottonwood Grille recently selected a random sample of 18 customers and kept track of how long the customers were required to wait from the time they arrived at the restaurant until they were actually served dinner. This study resulted from several complaints the manager had received from customers saying that their wait time was unduly long and that it appeared that the objective was to keep people waiting in the lounge for as long as possible to increase the lounge business. The following data were recorded, with time measured in minutes: 34 24 43 56 74 20 18 33 55 43 45 34 27 34 36 24 54 39 (A) Compute the mean, median, mode, range, lower quartile, upper quartile, variance and standard deviation. (B) Construct a box and whisker plot. Indicate if there is any outlier. (C) Using part (B), indicate whether the data are skewed or symmetrical. (D) The is considering giving a complementary drink to customers whose waiting time is longer than the third quartile. Determine the minimum number of minutes a customer would have to wait in order to receive a complementary drink

Holt Mcdougal Larson Pre-algebra: Student Edition 2012
1st Edition
ISBN:9780547587776
Author:HOLT MCDOUGAL
Publisher:HOLT MCDOUGAL
Chapter11: Data Analysis And Probability
Section: Chapter Questions
Problem 8CR

Related questions
Question
Answer for question D
Transcribed Image Text:12. The manager of the Cottonwood Grille recently selected a random sample of 18 customers and kept track
of how long the customers were required to wait from the time they arrived at the restaurant until they were
actually served dinner. This study resulted from several complaints the manager had received from
customers saying that their wait time was unduly long and that it appeared that the objective was to keep
people waiting in the lounge for as long as possible to increase the lounge business. The following data
were recorded, with time measured in minutes:
34
24
43
56
74
20
18
33
55
43
45
34
27
34
36
24
54
39
(A) Compute the mean, median, mode, range, lower quartile, upper quartile, variance and standard
deviation.
(B) Construct a box and whisker plot. Indicate if there is any outlier.
(C) Using part (B), indicate whether the data are skewed or symmetrical.
(D) The is considering giving a complementary drink to customers whose waiting time is longer than the
third quartile. Determine the minimum number of minutes a customer would have to wait in order to
receive a complementary drink.
Expert Solution
This question has been solved!
Explore an expertly crafted, step-by-step solution for a thorough understanding of key concepts.

Step by step
Solved in 3 steps with 3 images

Recommended textbooks for you
Holt Mcdougal Larson Pre-algebra: Student Edition…
Algebra
ISBN:
9780547587776
Author:
HOLT MCDOUGAL
Publisher:
HOLT MCDOUGAL
Holt Mcdougal Larson Pre-algebra: Student Edition…
Algebra
ISBN:
9780547587776
Author:
HOLT MCDOUGAL
Publisher:
HOLT MCDOUGAL