1.a. Use the table below. Model the relation with a scatter plot and a trend line. b. Predict the value of y when x-10. 2.0 5.0 2.5 6.0 7.0 1.0 -1.5 3.0 4.0 0.0 1.5 2.0 3.5 4.0
1.a. Use the table below. Model the relation with a scatter plot and a trend line. b. Predict the value of y when x-10. 2.0 5.0 2.5 6.0 7.0 1.0 -1.5 3.0 4.0 0.0 1.5 2.0 3.5 4.0

Glencoe Algebra 1, Student Edition, 9780079039897, 0079039898, 2018
18th Edition
ISBN:9780079039897
Author:Carter
Publisher:Carter
Chapter10: Statistics
Section10.6: Summarizing Categorical Data
Problem 23PPS

Related questions
Question
100%
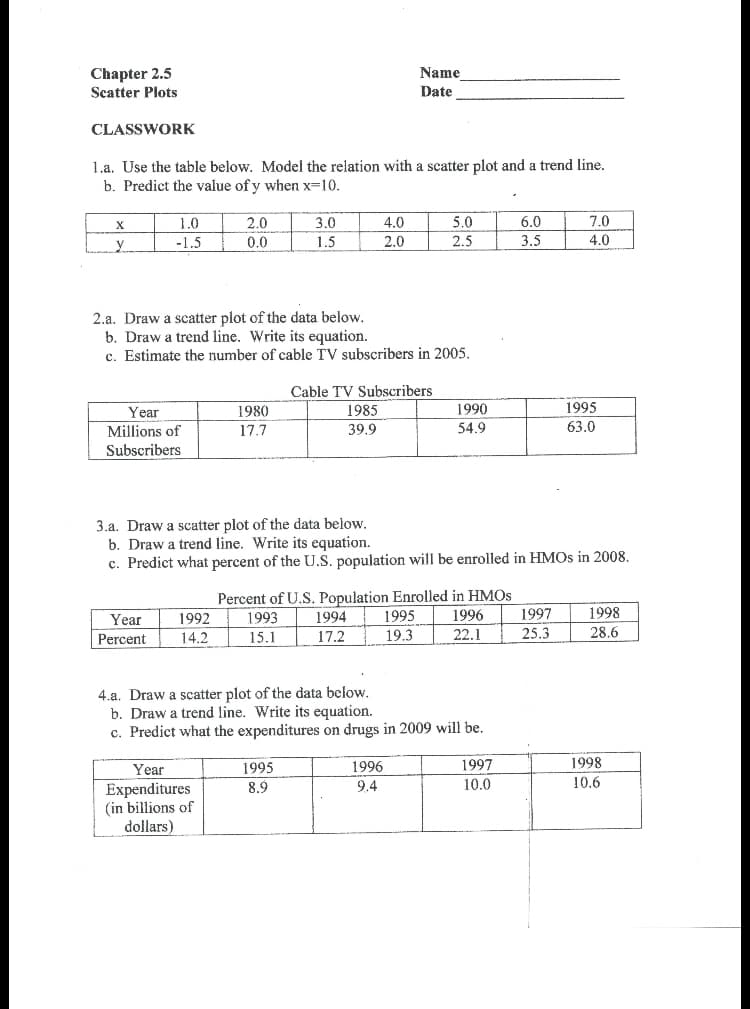
Transcribed Image Text:Chapter 2.5
Scatter Plots
Name
Date
CLASSWORK
1.a. Use the table below. Model the relation with a scatter plot and a trend line.
b. Predict the value of y when x=10.
X
1.0
2.0
3.0
4.0
5.0
6.0
7.0
y
-1.5
0.0
1.5
2.0
2.5
3.5
4.0
2.a. Draw a scatter plot of the data below.
b. Draw a trend line. Write its equation.
c. Estimate the number of cable TV subscribers in 2005.
Cable TV Subscribers
Year
1980
1985
1990
1995
63.0
Millions of
Subscribers
17.7
39.9
54.9
3.a. Draw a scatter plot of the data below.
b. Draw a trend line. Write its equation.
c. Predict what percent of the U.S. population will be enrolled in HMOS in 2008.
Percent of U.S. Population Enrolled in HMOS
1995
Year
1992
1993
1994
1996
1997
1998
Percent
14.2
15.1
17,2
19.3
22.1
25.3
28.6
4.a. Draw a scatter plot of the data below.
b. Draw a trend line. Write its equation.
c. Predict what the expenditures on drugs in 2009 will be.
Year
1995
1996
1997
1998
10.6
Expenditures
(in billions of
dollars)
8.9
9.4
10.0
Expert Solution
This question has been solved!
Explore an expertly crafted, step-by-step solution for a thorough understanding of key concepts.

This is a popular solution!

Trending now
This is a popular solution!

Step by step
Solved in 4 steps with 3 images

Recommended textbooks for you
Glencoe Algebra 1, Student Edition, 9780079039897…
Algebra
ISBN:
9780079039897
Author:
Carter
Publisher:
McGraw Hill

Holt Mcdougal Larson Pre-algebra: Student Edition…
Algebra
ISBN:
9780547587776
Author:
HOLT MCDOUGAL
Publisher:
HOLT MCDOUGAL

Big Ideas Math A Bridge To Success Algebra 1: Stu…
Algebra
ISBN:
9781680331141
Author:
HOUGHTON MIFFLIN HARCOURT
Publisher:
Houghton Mifflin Harcourt
Glencoe Algebra 1, Student Edition, 9780079039897…
Algebra
ISBN:
9780079039897
Author:
Carter
Publisher:
McGraw Hill
Holt Mcdougal Larson Pre-algebra: Student Edition…
Algebra
ISBN:
9780547587776
Author:
HOLT MCDOUGAL
Publisher:
HOLT MCDOUGAL
Big Ideas Math A Bridge To Success Algebra 1: Stu…
Algebra
ISBN:
9781680331141
Author:
HOUGHTON MIFFLIN HARCOURT
Publisher:
Houghton Mifflin Harcourt