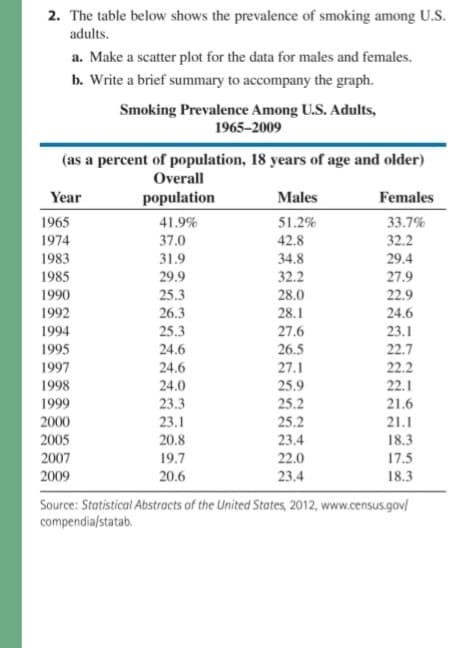
2. The table below shows the prevalence of smoking among U.S. adults. a. Make a scatter plot for the data for males and females. b. Write a brief summary to accompany the graph. Smoking Prevalence Among U.S. Adults, 1965–2009 (as a percent of population, 18 years of age and older) Overall Year population Males Females 1965 1974 1983 41.9% 51.2% 33.7% 37.0 42.8 32.2 31.9 34.8 29.4 1985 29.9 32.2 27.9 1990 25.3 28.0 22.9 1992 26.3 28.1 24.6 1994 25.3 27.6 23.1 26.5 27.1 25.9 25.2 1995 24.6 22.7 1997 24.6 22.2 1998 24.0 22.1 1999 23.3 21.6 21.1 2000 23.1 25.2 2005 20.8 23.4 22.0 23.4 18.3 19.7 2007 2009 17.5 20.6 18.3 Source: Statistical Abstracts of the United States, 2012, www.census.gov/ compendia/statab.
2. The table below shows the prevalence of smoking among U.S. adults. a. Make a scatter plot for the data for males and females. b. Write a brief summary to accompany the graph. Smoking Prevalence Among U.S. Adults, 1965–2009 (as a percent of population, 18 years of age and older) Overall Year population Males Females 1965 1974 1983 41.9% 51.2% 33.7% 37.0 42.8 32.2 31.9 34.8 29.4 1985 29.9 32.2 27.9 1990 25.3 28.0 22.9 1992 26.3 28.1 24.6 1994 25.3 27.6 23.1 26.5 27.1 25.9 25.2 1995 24.6 22.7 1997 24.6 22.2 1998 24.0 22.1 1999 23.3 21.6 21.1 2000 23.1 25.2 2005 20.8 23.4 22.0 23.4 18.3 19.7 2007 2009 17.5 20.6 18.3 Source: Statistical Abstracts of the United States, 2012, www.census.gov/ compendia/statab.

Glencoe Algebra 1, Student Edition, 9780079039897, 0079039898, 2018
18th Edition
ISBN:9780079039897
Author:Carter
Publisher:Carter
Chapter10: Statistics
Section10.6: Summarizing Categorical Data
Problem 4DGP

Related questions

Question
100%
Transcribed Image Text:2. The table below shows the prevalence of smoking among U.S.
adults.
a. Make a scatter plot for the data for males and females.
b. Write a brief summary to accompany the graph.
Smoking Prevalence Among U.S. Adults,
1965–2009
(as a percent of population, 18 years of age and older)
Overall
Year
population
Males
Females
1965
41.9%
51.2%
33.7%
1974
37.0
42.8
32.2
1983
31.9
34.8
29.4
1985
29.9
32.2
27.9
1990
25.3
28.0
22.9
1992
26.3
28.1
24.6
1994
25.3
27.6
23.1
1995
24.6
26.5
22.7
1997
24.6
27.1
22.2
25.9
25.2
1998
24.0
22.1
1999
23.3
21.6
2000
23.1
25.2
23.4
21.1
2005
2007
20.8
18.3
19.7
22.0
17.5
2009
20.6
23.4
18.3
Source: Statistical Abstracts of the United States, 2012, www.census.gov/
compendia/statab.
Expert Solution
This question has been solved!
Explore an expertly crafted, step-by-step solution for a thorough understanding of key concepts.

Step by step
Solved in 2 steps with 1 images

Knowledge Booster


Learn more about
Need a deep-dive on the concept behind this application? Look no further. Learn more about this topic, statistics and related others by exploring similar questions and additional content below.Recommended textbooks for you
Glencoe Algebra 1, Student Edition, 9780079039897…
Algebra
ISBN:
9780079039897
Author:
Carter
Publisher:
McGraw Hill

Holt Mcdougal Larson Pre-algebra: Student Edition…
Algebra
ISBN:
9780547587776
Author:
HOLT MCDOUGAL
Publisher:
HOLT MCDOUGAL

Functions and Change: A Modeling Approach to Coll…
Algebra
ISBN:
9781337111348
Author:
Bruce Crauder, Benny Evans, Alan Noell
Publisher:
Cengage Learning
Glencoe Algebra 1, Student Edition, 9780079039897…
Algebra
ISBN:
9780079039897
Author:
Carter
Publisher:
McGraw Hill
Holt Mcdougal Larson Pre-algebra: Student Edition…
Algebra
ISBN:
9780547587776
Author:
HOLT MCDOUGAL
Publisher:
HOLT MCDOUGAL
Functions and Change: A Modeling Approach to Coll…
Algebra
ISBN:
9781337111348
Author:
Bruce Crauder, Benny Evans, Alan Noell
Publisher:
Cengage Learning