10. Deriving demand from an indifference map Teresa lives in Denver and enjoys drinking lattes and eating scones. The price of a latte is held constant at $3 throughout this problem. On the following diagram, the purple curves (11 and 12) represent two of Teresa's indifference curves. The lines BL₁ and BL2 show two budget lines. Points X and Y show Teresa's consumer equilibriums subject to these budget lines. QUANTITY OF LATTES 20 18 16 14 2 0 0 2 4 BL 6 8 10 12 14 QUANTITY OF SCONES 16 BL 18 20 Given the previous graph and knowing the price of a latte is $3, Teresa's budget is $ Price When Teresa's budget line is... (Dollars per scone) Using the budget amount you previously computed, complete the following table by finding the price of a scone when BL₁ represents Teresa's budget line and when BL2 represents her budget line. Then indicate the quantity of scones consumed in each of those scenarios. (?) Consumption (Scones)
10. Deriving demand from an indifference map Teresa lives in Denver and enjoys drinking lattes and eating scones. The price of a latte is held constant at $3 throughout this problem. On the following diagram, the purple curves (11 and 12) represent two of Teresa's indifference curves. The lines BL₁ and BL2 show two budget lines. Points X and Y show Teresa's consumer equilibriums subject to these budget lines. QUANTITY OF LATTES 20 18 16 14 2 0 0 2 4 BL 6 8 10 12 14 QUANTITY OF SCONES 16 BL 18 20 Given the previous graph and knowing the price of a latte is $3, Teresa's budget is $ Price When Teresa's budget line is... (Dollars per scone) Using the budget amount you previously computed, complete the following table by finding the price of a scone when BL₁ represents Teresa's budget line and when BL2 represents her budget line. Then indicate the quantity of scones consumed in each of those scenarios. (?) Consumption (Scones)

Micro Economics For Today
10th Edition
ISBN:9781337613064
Author:Tucker, Irvin B.
Publisher:Tucker, Irvin B.
Chapter6: Consumer Choice Theory
Section6.A: Indifference Curve Analysis
Problem 3SQP

Related questions
Question
10
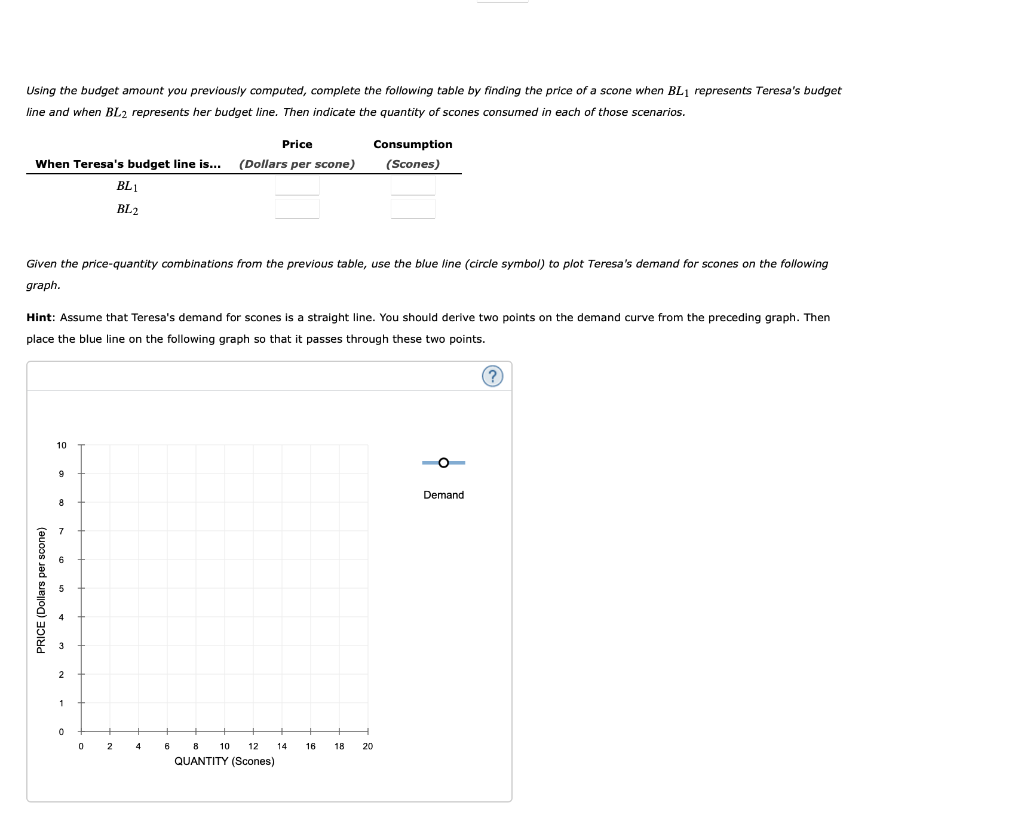
Transcribed Image Text:Using the budget amount you previously computed, complete the following table by finding the price of a scone when BL₁ represents Teresa's budget
line and when BL2 represents her budget line. Then indicate the quantity of scones consumed in each of those scenarios.
Price
When Teresa's budget line is... (Dollars per scone)
Given the price-quantity combinations from the previous table, use the blue line (circle symbol) to plot Teresa's demand for scones on the following
graph.
PRICE (Dollars per scone)
Hint: Assume that Teresa's demand for scones is a straight line. You should derive two points on the demand curve from the preceding graph. Then
place the blue line on the following graph so that it passes through these two points.
?
10
9
8
1
0
BL1
BL2
0
2
4
6
8 10 12
QUANTITY (Scones)
14
Consumption
(Scones)
16
18 20
Demand
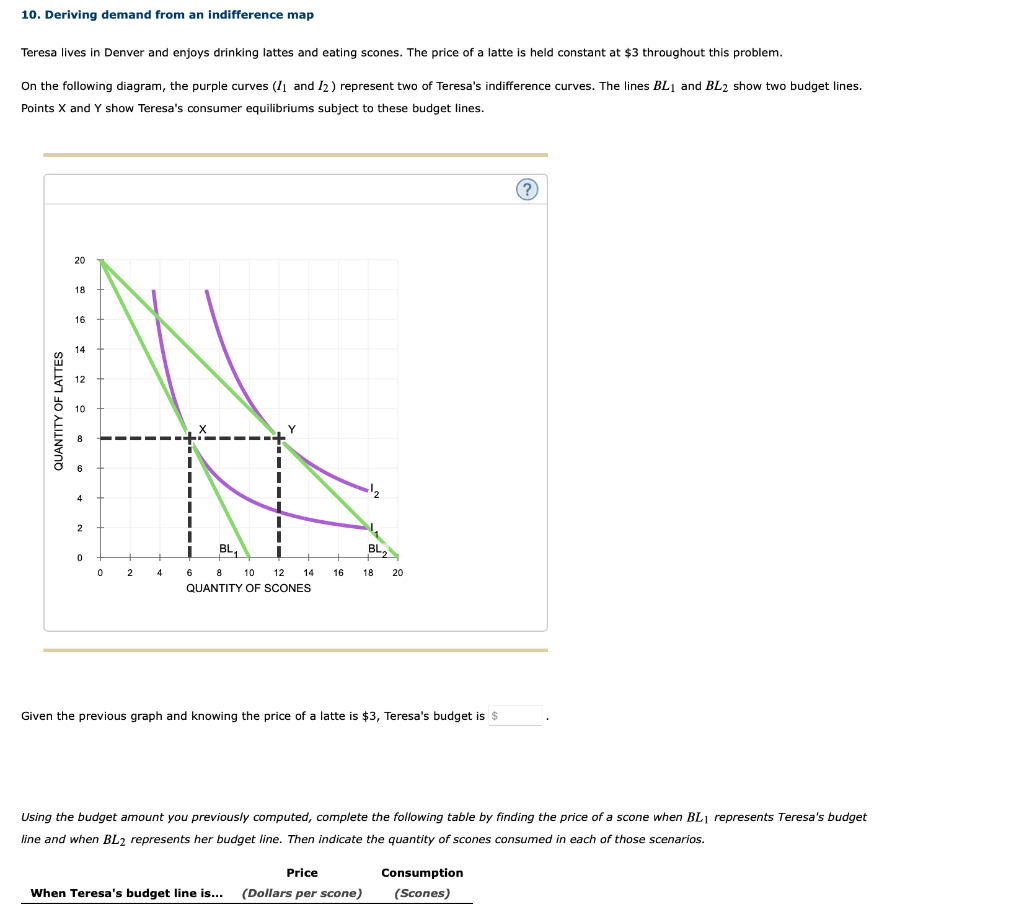
Transcribed Image Text:10. Deriving demand from an indifference map
Teresa lives in Denver and enjoys drinking lattes and eating scones. The price of a latte is held constant at $3 throughout this problem.
On the following diagram, the purple curves (11 and 12) represent two of Teresa's indifference curves. The lines BL₁ and BL2 show two budget lines.
Points X and Y show Teresa's consumer equilibriums subject to these budget lines.
QUANTITY OF LATTES
20
18
16
14
2
0
0
2
4
BL
6
8
10 12 14
QUANTITY OF SCONES
16
BL
18 20
Given the previous graph and knowing the price of a latte is $3, Teresa's budget is $
Price
When Teresa's budget line is... (Dollars per scone)
Using the budget amount you previously computed, complete the following table by finding the price of a scone when BL₁ represents Teresa's budget
line and when BL2 represents her budget line. Then indicate the quantity of scones consumed in each of those scenarios.
(?)
Consumption
(Scones)
Expert Solution
This question has been solved!
Explore an expertly crafted, step-by-step solution for a thorough understanding of key concepts.

This is a popular solution!

Trending now
This is a popular solution!

Step by step
Solved in 2 steps with 1 images

Knowledge Booster


Learn more about
Need a deep-dive on the concept behind this application? Look no further. Learn more about this topic, economics and related others by exploring similar questions and additional content below.Recommended textbooks for you

Exploring Economics
Economics
ISBN:
9781544336329
Author:
Robert L. Sexton
Publisher:
SAGE Publications, Inc

Principles of Economics (MindTap Course List)
Economics
ISBN:
9781305585126
Author:
N. Gregory Mankiw
Publisher:
Cengage Learning
Exploring Economics
Economics
ISBN:
9781544336329
Author:
Robert L. Sexton
Publisher:
SAGE Publications, Inc
Principles of Economics (MindTap Course List)
Economics
ISBN:
9781305585126
Author:
N. Gregory Mankiw
Publisher:
Cengage Learning

